The Relationship between Ureteral Obstruction Time and Secondary Signs in Computed Tomography due to Ureteral Stone Obstruction
By Murat Uçar1, Ozkan Özen2Affiliations
doi: 10.29271/jcpsp.2020.07.678ABSTRACT
Objective: To investigate the relationship between numerical values obtained using computed tomography (CT) in stone-related urinary obstruction and the duration of obstruction.
Study Design: Cross-sectional study.
Place and Duration of Study: Department of Urology, Alanya Alaaddin Keykubat University, Turkey, from January 2018 to September 2019.
Methodology: Eighty-three patients were investigated. Commencement of obstruction was defined as time of onset of pain. Cases with less than seven days elapsed between onset of obstruction; and CT were classified as acute obstruction; and those with durations of seven days or more as chronic obstruction. Bilateral renal parenchymal and renal fatty tissue densities were measured in three planes.
Results: Acute obstruction was present in 53 patients and chronic obstruction in 30. Median renal parenchymal densities in the obstructive and non-obstructive kidneys were 33 and 37 Hounsfield unit (HU), respectively; and median perirenal densities were 99 and 108 HU, the differences being statistically significant (p <0.05). Median perirenal density were 96 HU in acute obstruction and 104.5 HU in chronic obstruction and the difference was statistically significant (p <0.05). No statistically significant difference was determined between renal parenchymal density in acute and chronic obstruction (p >0.05).
Conclusions: A low perirenal density on CT indicated prolonged duration of urinary obstruction.
Key Words: Computed tomography, Hounsfield unit, Kidney stone, Ureter, Ureteral stone.
INTRODUCTION
The most significant clinical finding in ureteral stones is pain.1 The duration and character of this pain varies from case to case, but is generally severe, sudden-onset, and colic.2 The pain is caused by peristaltic contraction of the ureter in order to overcome the ureteral obstruction.
Obstruction-related dilatation occurs proximally to the obstruction, and this further exacerbates the pain. The gold standard imaging method for the diagnosis of ureter stones is non-contrast computed tomography (NCCT).3 NCCT is a safe (no contrast infusion), accurate, and rapid technique in the diagnosis of urinary system stone.4
Its sensitivity in diagnosing urinary system stone is 94-100%, with specificity of 92-100%.5 In addition to NCCT in stone diagnosis, the Hounsfield Unit (HU) value is obtained by measuring tissue and stone density. The HU value is different in different tissues.6
When obstruction occurs in the ureter for any reason, a series of obstruction-related changes occur in the urinary system. Renal intrapelvic pressure increases transiently or permanently and pyelovenous and pyelo-lymphatic reflux occur.7 This leads to hydronephrosis and urine leakage into the perirenal region. Density of ureteral wall and renal parenchyma, density of periureteral and perirenal tissues can be measured using NCCT. Obstructed and non-obstructed system results different HU when the densities of tissues are evaluated with NCCT.8 Renal cortex and papillae density are higher in stone kidney compared to stoneless opposite kidney of the same patient.9 A study in rats showed decreased kidney parenchymal density due to ureteral obstruction. Kidney parenchymal density may reflect renal parenchymal damage.10
Periureteral tissue, renal parenchyma, and perirenal tissue densities change in ureteral stone-related obstruction, depending on the type of stone.11 NCCT findings in patients who have passed a kidney stone only return to normal after a some time has elapsed.12 Patient tolerability increases during the presence of stone in the ureter, and pain may gradually decrease. Tissue densities at NCCT vary in urinary system according to obstruction time. The purpose of this study was to investigate the relationships between urinary obstruction time due to ureteral stone and renal parenchymal and perirenal fatty tissue.
METHODOLOGY
Following receipt of Ethical Committee approval, patient data were examined retrospectively from the Alanya Alaaddin Keykubat University Hospital information system. Ninety-nine patients undergoing NCCT between January 2018 and September 2019, with stone-related unilateral urinary obstruction, and with no laboratory and/or clinical findings of infections were investigated retrospectively. Fifteen of these patients were excluded due to renal parenchymal atrophy/small size, and one due to renal ectopia. Eighty-three patients met the inclusion criteria; and they were enrolled in the study.
The onset of pain based on anamnesis was adopted as onset of obstruction. Time of onset of urinary system obstruction and time when CT was performed were recorded. In literature, we could not find any definition of acute urinary obstruction and chronic urinary obstruction. Cases were divided into two groups; those in which the time elapsed between onset of urinary obstruction and CT was less than seven days were regarded as acute obstruction; and those with periods of seven days or more as chronic obstruction. The same patients’ contralateral non-obstructive kidneys were examined as the control group.
Evaluations were performed separately by a single radiologist with 13 years’ experience in the field of radiology, and by a single specialist physician with five years’ experience in the field of urology. Then a consensus was reached by reassessing together for each patient.
CT examinations were performed on a 16-detector CT device (Toshiba Alexion™/Advance, Toshiba Medical Systems Corporation Nashu, Japan). Parameters for abdominal CT were set at 1 mm thickness; 120 kVp; 50-65 mAs; 0.938 pitch; 0.75 s rotation time; 16x1 collimation; matrix 512x512; and 250x300 mm FOV. Evaluations were performed using three-dimensional (3D) multiplanar image reformation and maximum density projections on a radiology workstation (Sectra Workstation IDS 7, Linköping, Sweden).
Renal parenchyma and perirenal fat density measurements at CT were made in the axial plane from the upper/middle/lower pole levels of both kidneys. Density values measured in the renal parenchyma at all three pole levels and in perirenal fat tissue at the same planes using a circular region of interest (ROI) in three separate areas. The means of the renal parenchyma and perirenal fat, obtained were calculated (Figure 1,2).
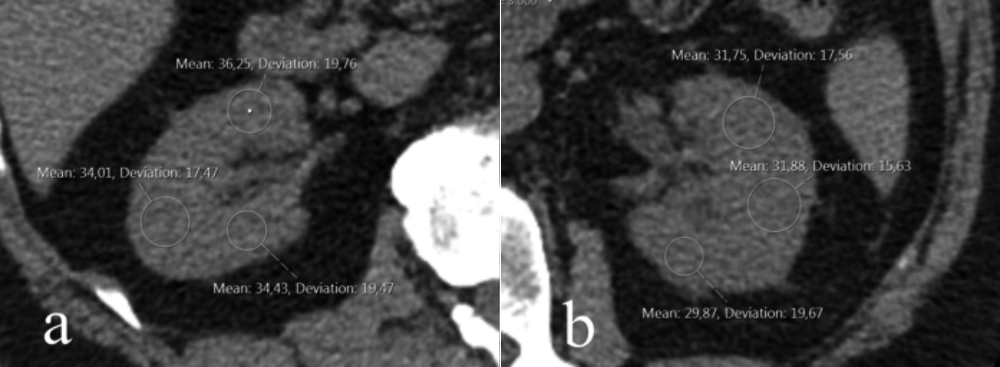 Figure 1 (a,b): Bilateral renal parenchymal density measurement from the middle part of the renal hilum at computed tomography. The right kidney is normal (Figure 1a), while ureteral obstruction can be seen in the left kidney (Figure 1b).
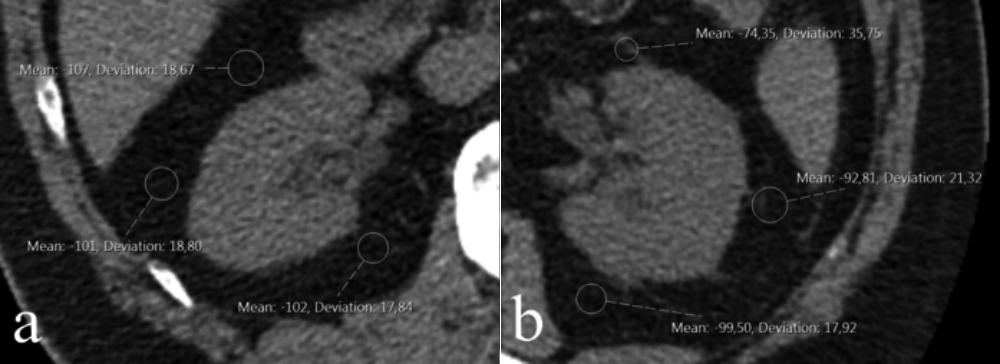 Figure 2 (a,b): Bilateral perirenal fat tissue density measurement from the middle part of the renal hilum at computed tomography. The right kidney is normal (Figure 2a), while ureteral obstruction can be seen in the left kidney (Figure 2b).
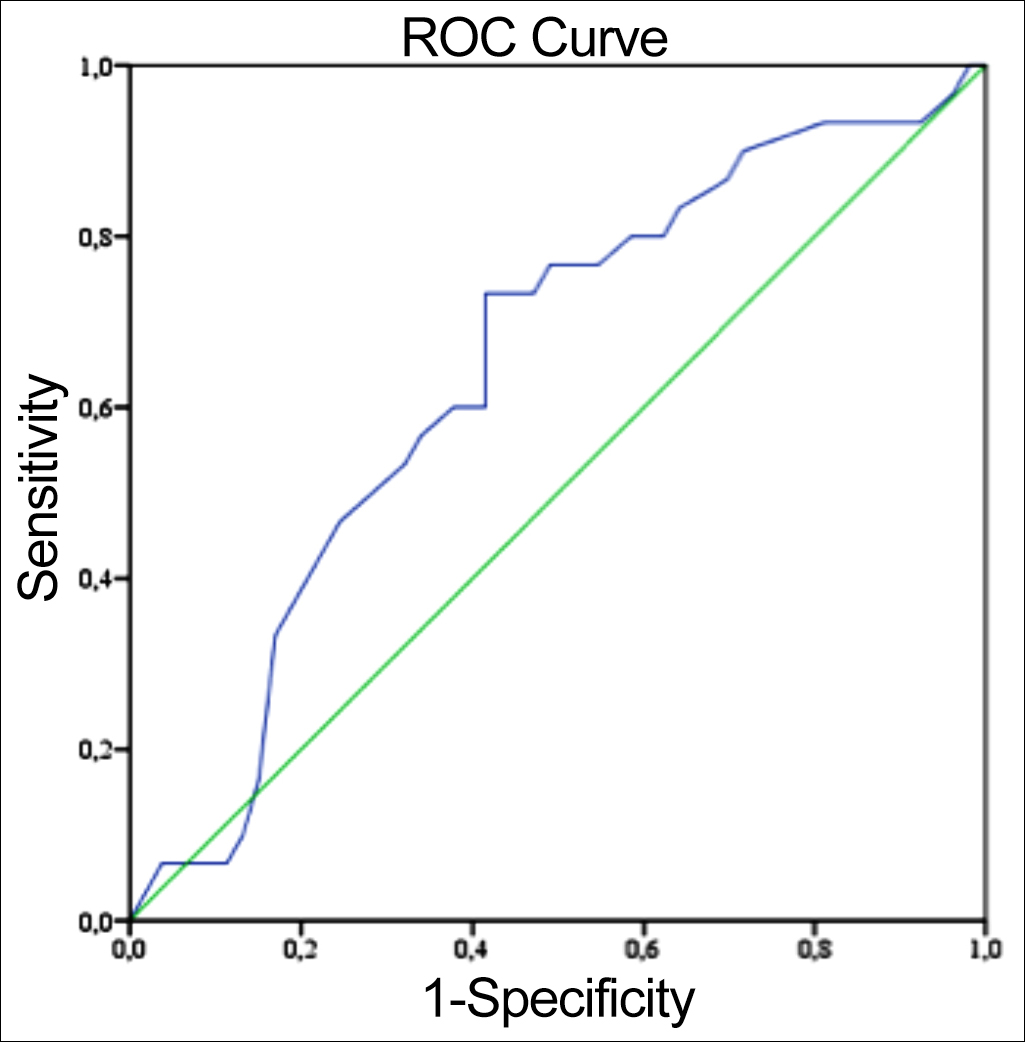 Figure 3: ROC analysis chart for estimation of duration of obstruction based on perirenal density.
Descriptive statistics were expressed as number and percentage values for categorical data. In normally distributed continuous variables were expressed as mean ± standard deviation. Median interquartile range values were determined for abnormal distributed continuous variables. Normal distribution assumptions for measurement data were examined using the Shapiro-Wilk test.
The p-values >0.05 was assumed to indicate normal distribution and were confirmed using histogram charts. The independent groups t-test was used to compare normally distributed data, and the Mann-Whitney U-test for abnormal distributed measurement data. A threshold value for predicting duration of the disease by examining perirenal and parenchymal densities was determined at receiver operating characteristic (ROC) curve analysis. The p-values <0.05 were regarded as statistically significant for all analysis, which were performed on IBM © SPSS version 20 software.
Table I: Renal parenchymal density and perirenal density values in acute and chronic obstruction.
|
|
Acute (<7 days) n = 53 (63.9%) |
Chronic (≥7 days) n = 30 (36.1%) |
p-value |
|
Median (IQR) |
Median (IQR) |
||
|
RPD (HU) |
32.0 (31.0-34.0) |
33.0 (30.0-35.0) |
0.871 |
|
Perirenal density (HU) |
96.0 (90.0 - 105.0) |
104.5 (97.0 - 109.0) |
0.032 |
|
RPD = Renal parenchymal density, Mann-Whitney U-test. |
|||
Table II: ROC curve analysis results.
|
Time |
7 days |
10 days |
|
Area under the curve (AUC) |
0.639 |
0.642 |
|
Confidence interval lower limit 95% for AUC |
0.500 |
0.520 |
|
Confidence interval upper limit 95% for AUC |
0.777 |
0.765 |
|
p |
0.055 |
0.032 |
|
Threshold value |
|
98 |
|
Sensitivity |
73.3 |
|
|
Specificity |
58.4 |
|
|
Positive predictive value |
50.0 |
|
|
Negative predictive value |
79.5 |
RESULTS
The NCCT images of 83 ureteral stone patients were examined. Twenty-four (28.9%) of them were women and 59 (71.1%) of them were men. The mean age of the patients was 36.9 ±10.3 years. Duration of urinary obstruction was <7 days (defined as acute obstruction) in 53 cases and ≥7 days (defined as chronic obstruction) in 30 cases. Median obstruction durations in the acute and chronic groups were 2 and 30 days, respectively (Table I).
Renal parenchymal density was significantly lower and perirenal density was significantly higher, in the presence of obstruction. Median renal parenchymal density and perirenal density in the obstructive kidneys were 33 (30.0-34.0) HU and 99 (92.0-107.0) HU, respectively, compared to 37 (35.0-38.0) HU and 108 (103.0-113.0) HU in the non-obstructive kidneys (p <0.001 for both).
Perirenal density was significantly lower in patients with chronic obstruction than in those with acute obstruction. Median perirenal density values were 96.0 (90.0 - 105.0) HU in the acute obstruction group and 104.5 (97.0 - 109.0) HU in the chronic obstruction group (p = 0.032). There was no statistically significant difference between the chronic and acute obstruction patients in terms of renal parenchymal density (p: 0.871, Table I).
ROC analysis for perirenal density revealed a density value of 98 HU and an obstruction duration of 10 days or above as significant predictors. If perirenal density 98 or less that indicates this obstruction was longer than 10 days. (Figure 3 and Table II). When it was accepted as 7 days threshold value no statistically significant threshold value for predicting duration of disease at ROC analysis.
DISCUSSION
Renal parenchymal density may change secondary to hydronephrosis occurring in ureteral obstruction. In a rat study, Yıldırım et al. reported lower renal parenchymal density in the obstructed kidney than in the non-obstructed kidney in the same animal.10 Measurement of renal parenchymal density from any point of the renal parenchyma is reported to be sufficient and there is no significant difference between measurements from upper, middle or lower pole. Another study reported lower parenchymal density in the obstructed kidney compared to the non-obstructed kidney.13 A difference in parenchymal density exceeding 5 HU was determined between the obstructed and non-obstructed kidneys in 89.1% of patients. Another study reported that a density difference of 5 HU or more was diagnostic or ureteral stone with 100% specificity, a 100% positive predictive value, and 79% accuracy.14 Similarly, in the present study, renal parenchymal density was lower in the presence of obstruction than in the non-obstructed kidney.
Erbaş et al. observed a higher mean renal parenchymal density in chronic obstruction than in acute obstruction.15 However, no significant difference was observed in renal parenchymal density between acute and chronic obstruction in the present study. The discrepancy between the two studies may be due to the lack of a clear definition of acute and chronic obstruction. In the present study, acute obstruction was defined as onset of pain in less than seven days, while chronic obstruction was defined as pain persisting for more than seven days.
Perirenal density increases in addition to the secondary finding of the obstructed kidney at NCCT. Chou et al. also observed more thinning in perirenal thickness in the presence of obstruction.11 In the present study, perirenal density in the obstructed kidney was significantly greater than in the non-obstructed kidney. Perirenal density was also significantly higher in patients with acute obstruction than in those with chronic obstruction. This may be due to urine leaking into the perirenal area in the acute period secondary to obstruction further altering the density in the perirenal region. Another reason for this may be that perirenal density reaches normal values with compensatory mechanisms as the event becomes chronic.
Perirenal density varies depending on the ureteral obstruction and the duration of obstruction.16 This study estimated duration of disease by examining perirenal density. According to ROC analysis, perirenal density values of 98 or less indicated duration of obstruction 10 days or more. Our scan of the literature suggests that this the first study establishing a link between perirenal density and duration of urinary obstruction. Knowing that obstruction has been present for a prolonged period can assist with establishing the urgency of the intervention to be performed. If obstruction is longstanding, then the intervention to be performed is not urgent, except in rare conditions such as solitary kidney or obstruction-related pyelonephritis.17,18 Erbaş et al. evaluated renal parenchymal density for the differentiation of acute and chronic obstruction but detected no significant threshold.15 The authors think that this may again be due to the absence of specific definitions of acute and chronic obstructions.
There are number of limitations to this study. One is that, time of onset of pain was adopted as onset of obstruction and this information was got from patients’ declarations. This may on rare occasions not actually apply and some memory problems can effect our results. Another limitation is that we classified the patients' obstruction time as acute or chronic, while we considered them as 7 days or 10 days. Since there are no definitions of acute or chronic obstructions in the literature, we made these definitions in this way. If we defined the acute and chronic obstruction time differently, the results might have been different.
CONCLUSION
Changes occur in the renal parenchymal and perirenal areas secondary to obstruction in ureteral stone-related obstructions. These changes may vary depending on the duration of the obstruction. While no change occurs in renal parenchymal density depending on whether obstruction is acute or chronic, perirenal density is higher in acute obstruction. It may be concluded that perirenal density of 98 or less indicates that this urinary obstruction has been present for at least 10 days. Investigating perirenal density alone at NCCT, when clinical histories obtained from patient, is insufficient can yield useful information concerning the duration of obstruction.
ETHICAL APPROVAL:
All procedures performed in this study involving human participants were in accordance with the ethical standards of the İnstitutional Research Committee and with the 1964 Helsinki Declaration and its later amendments or comparable ethical standards. This study was approved by Alanya Alaaddin Keykubat University Medical Ethics Committee, (10354421 - 2019/2) Turkey.
PATIENTS’ CONSENT:
Informed consents were obtained from all participants included in the study. Additional informed consents were obtained from all participants for whom identifying information is included in this article.
CONFLICT OF INTEREST:
All authors declared no conflict of interest.
AUTHORS’ CONTRIBUTION:
MU: Conception of the work, analysis or interpretation of data for the work.
ÖÖ: Analysis or interpretation of data for the work; drafting the work.
REFERENCES
- Wang M, Ma Q, Chen Y, Li J, Wang C, Jin Y, et al. The value of shadowing and the twinkling artifact in the diagnosis of ureteral stones: A single-center study. Urology 2019; 126:39-44. doi: 10.1016/j.urology.2019.01.021.
- Palmisano F, Spinelli MG, Luzzago S, Boeri L, De Lorenzis E, Albo G, et al. Medical expulsive therapy for symptomatic distal ureter stones: Is the combination of bromelain and tamsulosin more effective than tamsulosin alone? preliminary results of a single-center study. Urol Int 2019; 102(2):145-52. doi: 10.1159/000493158.
- Smith-Bindman R, Aubin C, Bailitz J, Bengiamin RN, Camargo CA, Jr Corbo J, et al. Ultrasonography versus computed tomography for suspected nephrolithiasis. N Engl J Med 2014; 371(12):1100-10. doi: 10.1056/ NEJMoa1404446.
- Ahmad NA, Ather MH, Rees J. Unenhanced helical computed tomography in the evaluation of acute flank pain. Int J Urol 2003; 10(6):287-92. doi: 10.1046/ j.1442-2042.2003.00628.x.
- Bultitude M, Rees J. Management of renal colic. BMJ (Clinical research ed) 2012; c345:e5499. doi: 10.1136/ bmj.e5499.
- Motley G, Dalrymple N, Keesling C, Fischer J, Harmon W. Hounsfield unit density in the determination of urinary stone composition. Urology 2001; 58(2):170-3. doi: 10.1016/s0090-4295(01)01115-3.
- Mudraya IS, Khodyreva LA. The role of functional urodynamic disorders in the pathogenesis of urolithiasis. Arch Ital Urol Androl 2011; 83(1):31-6.
- Kim DW, Yoon SK, Ha DH, Kang MJ, Lee JH, Choi S. CT-based assessment of renal function impairment in patients with acute unilateral ureteral obstruction by urinary stones. Abdom Imaging 2015; 40(7):2446-52. doi: 10.1007/ s00261-015-0417-9.
- Baran I, Voyvoda N, Tokgöz Ö, Tokgöz H. Can hounsfield unit values of the cortex and papillae determined by computed tomography demonstrate the possibility of kidney stone formation?. Eur J Radiol 2012; 81(7):1446-9. doi: 10.1016/j.ejrad.2011.03.054.
- Yildirim B, Açikgöz A, Danaci M, Ramazan A, Büyükalpelli R. Evaluation of hydronephrotic kidney parenchymal density by non-contrast multislice computed tomography. J Exp Clin Med 2012; 29(3):215-20. 10.5835/jecm.omu. 29.03.009.
- Chou YH, Chou WP, Liu ME, Li WM, Li CC, Liu CC, et al. Comparison of secondary signs as shown by unenhanced helical computed tomography in patients with uric acid or calcium ureteral stones. Kaohsiung J Med Sci. 2012; 28(6):322-6. doi: 10.1016/j.kjms.2011.11.013.
- Huang CC, Wong YC, Wang LJ, Chiu TF, Ng CJ, Chen JC. Decreased renal parenchymal density on unenhanced helical computed tomography for diagnosis of ureteral stone disease in emergent patients with acute flank pain. Chang Gung Med J 2008; 31(2):182-9.
- Ozer C, Yencilek E, Apaydin FD, Duce MN, Yildiz A, Erdem E, et al. Diagnostic value of renal parenchymal density difference on unenhanced helical computed tomography scan in acutely obstructing ureteral stone disease. Urology 2004; 64(2):223-7. discussion 226-7. doi: 10.1016/ j.urology.2004.03.058.
- Goldman SM, Faintuch S, Ajzen SA, Christofalo DMJ, Araújo MP, Ortiz V, et al. Diagnostic value of attenuation measurements of the kidney on unenhanced helical CT of obstructive ureterolithiasis. AJR Am J Roentgenol 2004; 182(5):1251-4. doi: 10.2214/ajr.182.5.1821251.
- Erbaş G, Oktar S, Kiliç K, Sen I, Budakoğlu II, Araç M. Unenhanced urinary CT: Value of parenchymal attenuation measurements in differentiating acute vs. chronic renal obstruction. Eur J Radiol 2012; 81(5):825-9. doi: 10.1016/ j.ejrad.2011.02.029.
- Smith RC, Verga M, Dalrymple N, McCarthy S, Rosenfield AT. Acute ureteral obstruction: value of secondary signs of helical unenhanced CT. AJR Am J Roentgenol 1996; 167(5):1109-13. doi: 10.2214/ajr.167.5.8911160
- Canes D, Hegarty NJ, Kamoi K, Haber GP, Berger A, Aron M, et al. Functional outcomes following percutaneous surgery in the solitary kidney. J Urol 2009; 181(1):154-60. doi: 10.1016/j.juro.2008.09.023.
- Shokeir AA, Provoost AP, Nijman RJ. Recoverability of renal function after relief of chronic partial upper urinary tract obstruction. BJU Int 1999; 83(1):11-7. doi: 10.1046/ j.1464-410x.1999.00889.x.