Systemic Immune-inflammation Index (SII) Predicts Pathological Complete Response to Neoadjuvant Chemoradiotherapy in Locally Advanced Rectal Cancer
By Emrah Eraslan1, Yasemin Guzle Adas2, Fatih Yildiz1, Aysegul Ilhan Gulesen1, Cengiz Karacin1, Ulku Yalcintas Arslan1Affiliations
doi: 10.29271/jcpsp.2021.04.399ABSTRACT
Objective: To determine the relationship between inflammatory markers and pathological complete response (pCR) in patients with locally advanced rectal cancer (LARC), who received neoadjuvant chemoradiotherapy (NACRT).
Study Design: Descriptive study.
Place and Duration of Study: Department of Medical Oncology, Dr. Abdurrahman Yurtaslan Oncology Training and Research Hospital, Ankara, Turkey from January 2014 to June 2020.
Methodology: Patients older than 18 years of age, who underwent NACRT with a diagnosis of LARC, and who had no disease or drug-use that could affect inflammatory parameters, were included in the study. Inflammatory indices (neutrophil-to-lymphocyte ratio-NLR, platelet-to-lymphocyte ratio-PLR, lymphocyte monocyte ratio-LMR, systemic immune-inflammation index-SII, prognostic nutritional index-PNI) and changes in these indices, were calculated from blood samples taken before NACRT and before surgery. The relationship between pCR and calculated inflammatory indices was evaluated by comparing patients with and without pCR.
Results: Out of the 932 patients, who received NACRT with a diagnosis of LARC, 188 were eligible for the study. Median values of baseline SII for pCR and non-pCR groups were 729.3 (595.4-894.8) and 869.9(567.2-1145.2, p=0.049). Baseline NLR and PLR levels were lower in the pCR group than the non-pCR group in univariate analysis with a tendency to statistical significance. In the logistic regression analysis, which included NLR, PLR, and SII, only SII <748 was found to be an independent predictive factor of pCR (OR: 0.471, 95% CI; 0.224–0.991, p=0.047).
Conclusion: Baseline SII might be an independent predictive factor for pCR in patients receiving NACRT with a diagnosis of LARC.
Key Words: Locally advanced rectal cancer, Neoadjuvant chemoradiotherapy, Pathological complete response, Inflammatory index, Systemic immune-inflammation index, SII, NLR, PLR, LMR, PNI.
INTRODUCTION
Neoadjuvant chemoradiotherapy (nCRT) and total mesorectal excision constitute the standard treatment for locally advanced rectal cancer (T3-4 and/or node positive) (LARC).1,2 It has been reported that nCRT administered for LARC has better local control compared to postoperative CRT and facilitates sphincter-sparing surgery in addition to having a lower toxicity profile.3
Using nCRT, pathological complete response (pCR) can be achieved in approximately one-fourth of the patients diagnosed with LARC.3,4 A relationship was observed between pCR with neoadjuvant therapy and better clinical prognosis in terms of distant organ metastasis, disease-free survival (DFS) and overall survival (OS).4,5 Although the presence of a pathological response is associated with a good clinical prognosis, a standard biomarker for predicting response to treatment before nCRT has not yet been defined. Hence, clinical or laboratory markers that can be used for this purpose can provide additional benefits in optimising the treatment strategies of patients with rectal cancer.In recent years, studies have been published indicating that inflammatory markers may be useful in predicting colorectal cancer prognosis. In a meta-analysis, a high level of platelet-to-lymphocyte ratio (PLR) was reported to be a predictive factor of poor DFS in patients with colorectal cancer and poor OS in patients with metastatic colorectal cancer.6 Similarly, in another meta-analysis, a relationship was reported between pre-treatment increased neutrophil-to-lymphocyte ratio (NLR) and poor survival.7 Although contradictory results have been reported regarding the prognostic significance of systemic immune-inflammation index (SII), which is calculated on the basis of neutrophil, platelet and lymphocyte counts, and is defined as a novel marker compared to other inflammatory markers, a recent meta-analysis reported a relationship between high SII and poor prognosis.8 Another marker reported to be useful in predicting the prognosis of patients with colorectal cancer is the prognostic nutritional index (PNI), which is calculated on the basis of inflammatory parameters and albumin value.9 It has been reported that inflammatory markers and the changes observed in them during nCRT can predict pCR in patients with LARC.10
However, evidence on the relationship between inflammatory markers and pathological response to nCRT is insufficient in the existing literature.
The present study aimed to investigate the presence of a relationship between pCR and inflammatory markers before and after nCRT, and the rate of changes in these markers in patients with LARC who underwent nCRT.
METHODOLOGY
A total of 932 patients, diagnosed with LARC and receiving nCRT in SBU Dr. Abdurrahman Yurtaslan Ankara Oncology Training and Research Hospital (Ankara, Turkey) between 2014 and 2020, were reviewed. One hundred eighty-eight patients, who met the study criteria were included in the study. The medical records of these patients were reviewed retrospectively after obtaining the approval of the local ethics committee. Inclusion criteria were: histologically confirmed diagnosis of rectal adenocarcinoma, rectal cancer at a locally advanced stage and patients having received nCRT and curative surgery with R0 resection. Locally advanced stage was defined as stage II (T3-4/N0) or stage III (Any T/N positive) cancer according to the AJCC TNM cancer staging system (8th edition).11 Exclusion criteria were: interruption of neoadjuvant therapy for more than a week, dose reduction in chemotherapy or radiotherapy, no curative surgery, R1 or R2 resection, presence of rheumatologic, immunological and infectious (acute infections or active tuberculosis during the treatment or active chronic viral infections, such as hepatitis) disease that could affect inflammatory markers, presence of a secondary malignancy and use of drugs that could affect inflammatory markers.
All patients included in the study had received capecitabine or 5-fluorouracil-based chemotherapy, with treatment completion without dose reduction. The total radiation dose was 50.4 Gray (Gy) in 28 fractions for all patients, a 45 Gy dose to the entire pelvis, followed by a 5.4 Gy boost dose to the primary tumour. Radiotherapy was performed with a linear accelerator using high energy (≥6 MV) photons. The technique of radiotherapy was based on three dimensional conformal radiotherapy.
Age, gender, preoperative clinical TNM stage, pathological response level, postoperative pathological TNM stage, follow-up period, disease recurrence and mortality dates were recorded. Additionally, pCR was defined as the absence of viable tumour cells in the evaluated pathological specimen. Values of neutrophil, lymphocyte, monocyte and thrombocyte counts and albumin levels in the blood samples taken before the initiation of neoadjuvant therapy and within ten days before the surgery after completion of neoadjuvant therapy, were recorded. NLR, PLR, lymphocyte monocyte ratio (LMR), SII (platelet count × neutrophil count / lymphocyte count) and PNI (10 × serum albumin [g/dL] + 0.005 × total lymphocyte count [mm3]) were calculated using haematological parameters, and albumin values for the period before and after nCRT. Those calculated for the pre-nCRT period were termed as NLR-1, PLR-1, LMR-1, SII-1 and PNI-1, whereas those calculated for the post-nCRT period were termed as NLR-2, PLR-2, LMR-2, SII-2 and PNI-2. The changes in parameters were obtained by subtracting the values calculated for the pre-nCRT period from those calculated for the post-nCRT period; these were termed as NLR-C, PLR-C, LMR-C, SII-C and PNI-C. The rates of change were obtained by calculating the ratio between the post-nCRT period values with the pre-nCRT period values; these were termed as NLR-RC, PLR-RC, LMR-RC, SII-RC and PNI-RC. The effect of all these parameters on pCR was evaluated.
DFS was defined as the time from curative surgery to first recurrence; whereas, OS was defined as the time from pathological diagnosis to death or last contact date for surviving patients.
Statistical analysis was performed using SPSS software (SPSS for Windows, version 25.0., SPSS Inc., Chicago, USA). The distribution of data was evaluated using the Kolmogorov–Smirnov test. Non-parametric data were presented as median (interquartile range-IQR), and categorical data were presented as frequency (percentage). Mann–Whitney U-test was used for comparing non-parametric data. Pearson’s Chi-square test or Fisher’s Exact test was used for comparing categorical data. Receiver operating characteristic (ROC) analysis was performed to determine the optimum cut-off values for predicting pCR. As a result of the univariate analysis, variables with a p-value <0.200 were evaluated using multivariate analysis. Logistic regression analysis was performed to determine the independent factors for predicting pCR. Survival rates were estimated using the Kaplan–Meier method. All statistical analyses were two-sided, and p value <0.05 was considered statistically significant.
RESULTS
In the study, 188 patients, with LARC who had undergone nCRT treatment without dose reduction and R0 resection, were evaluated. Of these, 78 (41.5%) were females and 110 (58.5%) were males. The median age was 60 (52–67) years. At the time of diagnosis, 22 (11.7%) patients had TNM stage II (T3-4/N0) cancer and 166 (88.3%) patients had stage III (Any T/N positive) cancer. The median follow-up period was 32 (5–80) months.
Table I: Comparison of basic patient characteristics between pCR and Non-pCR groups.|
Characteristic |
pCR (n=35, 18.6%) |
Non-pCR (n=153, 81.4%) |
Total (N=188, 100%) |
p-value |
|
Age, year, median (IQR) |
57 (52-67) |
61 (50.5-66.5) |
60 (52-67) |
0.632 |
|
Gender, n (%) |
||||
|
Male |
21 (60.0) |
89 (58.2) |
110 (58.5) |
0.843 |
|
Female |
14 (40.0) |
64 (41.8) |
78 (41.5) |
|
|
Clinical stage |
||||
|
II (T3-4/N0) |
5 (14.3) |
17 (11.1) |
22 (11.7) |
0.568 |
|
III (Any T/N+) |
30 (85.7) |
136 (88.9) |
166 (88.3) |
|
|
Pre-CRT laboratory parameters |
||||
|
Neutrophil |
4570 (3910-5550) |
4900 (3990-5955) |
4840 (3980-5797.5) |
0.354 |
|
Lymphocyte* |
1890 (1460-2330) |
1790 (1395-2300) |
1815 (1422.5-2305) |
0.596 |
|
Monocyte* |
490 (420-630) |
480 (370-640) |
480 (382.5-637.5)h |
0.503 |
|
Platelet** |
284 (263-359) |
313 (238-383.5) |
299 (242.25-380.5) |
0.346 |
|
Albumin*** |
4.1 (3.81-4.3) |
4.1 (3.75-4.3) |
4.1 (3.8-4.3) |
0.585 |
|
pCR: pathological complete response, *per mm3, **1000x per mm3, ***g/dL |
||||
Table II: Evaluation of the relationship between inflammatory parameters and pathological complete responses using univariate analysis.
|
Variable |
pCR |
Non-pCR |
Total |
p-value |
|
NLR-1 |
2.42 (1.96-3.20) |
2.82 (2.16-3.53) |
2.75 (2.15-3.43) |
0.088 |
|
NLR-2 |
4.67 (3.18-7.14) |
4.55 (3.40-6.05) |
4.59 (3.36-6.30) |
0.796 |
|
NLR-C |
1.70 (0.41-4.42) |
1.63 (0.50-3.06) |
1.64 (0.42-3.20) |
0.619 |
|
NLR-RC |
1.64 (1.17-2.72) |
1.64 (1.17-2.23) |
1.64 (1.18-2.27) |
0.589 |
|
PLR-1 |
157.8 (129-199.5) |
168.5 (133.1-227.6) |
166.1 (132.7-214.6) |
0.130 |
|
PLR-2 |
291.1 (240.2-405.6) |
302.8 (225.9-412.6) |
298.8 (229.2-409.9) |
0.894 |
|
PLR-C |
129.7 (78-224.5) |
120.2 (63.4-199.8) |
121.6 (64.6-217.6) |
0.440 |
|
PLR-RC |
1.81 (1.47-2.65) |
1.72 (1.29-2.42) |
1.73 (1.37-2.46) |
0.473 |
|
LMR-1 |
3.95 (2.98-4.62) |
3.64 (2.86-4.89) |
3.69 (2.87-4.82) |
0.788 |
|
LMR-2 |
1.87 (1.51-2.71) |
2.15 (1.59-2.86) |
2.03 (1.58-2.82) |
0.330 |
|
LMR-C |
-1.86 (-2.68-(-0.99)) |
-1.48 (-2.49-(-0.57)) |
-1.57 (-2.57-(-0.60)) |
0.227 |
|
LMR-RC |
0.52 (0.42-0.64) |
0.60 (0.43-0.82) |
0.57 (0.43-0.82) |
0.215 |
|
SII-1 |
729.3 (595.4-894.8) |
869.9 (567.2-1145.2) |
835 (579-1100) |
0.049 |
|
SII-2 |
1014.5 (767.6-1721.8) |
1162.2 (795.9-1782.9) |
1147 (785-1724) |
0.484 |
|
SII-C |
248.7 (-112.7-902.8) |
325.3 (-75.4-705.5) |
314 (-82-792) |
0.796 |
|
SII-RC |
1.39 (0.85-2.43) |
1.40 (0.95-2.00) |
1.40 (0.95-2.04) |
0.739 |
|
PNI-1 |
49.4 (47.2-53.4) |
50 (45.4-52.8) |
49.9 (46.3-53) |
0.323 |
|
PNI-2 |
43.6 (39.5-46.4) |
43 (38.7-46.4) |
43.1 (38.9-46.4) |
0.826 |
|
PNI-C |
-8.2 (-11.6-(-2.8)) |
-6.4 (-10.9-(-2.1)) |
-6.7 (-11.0-(-2.2)) |
0.262 |
|
PNI-RC |
0.84 (0.75-0.94) |
0.88 (0.78-0.95) |
0.86 (0.78-0.95) |
0.276 |
|
NLR, neutrophil-to-lymphocyte ratio; PLR, platelet-to-lymphocyte ratio; LMR, lymphocyte monocyte ratio; SII, systemic immune-inflammation index; PNI, prognostic nutritional index; C, change; RC, rate of change. |
||||
Table III: The cut-off values of inflammatory markers derived from the ROC curve analysis for predicting tumor response.
|
Parameter |
Cut-off |
AUC |
Sensitivity |
Specificity |
p-value |
|
NLR-1 |
2.50 |
0.593 |
60.8% |
57.1% |
0.088 |
|
PLR-1 |
160 |
0.582 |
56.2% |
51.4% |
0.130 |
|
SII-1 |
748 |
0.607 |
61.4% |
57.1% |
0.049 |
Furthermore, 168 (89.4%) patients had received capecitabine and 20 (10.6%) had received 5-fluorouracil as the neoadjuvant chemotherapy concurrently with radiotherapy. Patients were divided into two groups: those with pCR (pCR) and those without pCR (non-pCR). Accordingly, 35 (18.6%) patients were in the pCR group and 153 (81.4%) were in the non-pCR group. Both groups were similar in terms of baseline patient characteristics, stage and laboratory parameters before treatment (Table I).
When the level of inflammatory markers calculated before and after nCRT and the change and rate of change in these parameters were evaluated, there was no significant difference between the pCR and non-pCR groups in terms of parameters other than SII-1. The median SII-1 level was 729.3 (595.4-894.8) in the pCR group and 869.9 (567.2-1145.2) in the non-pCR group (p = 0.049). The results of the univariate analysis evaluating the relationship between inflammatory markers and pCR are shown in Table II.
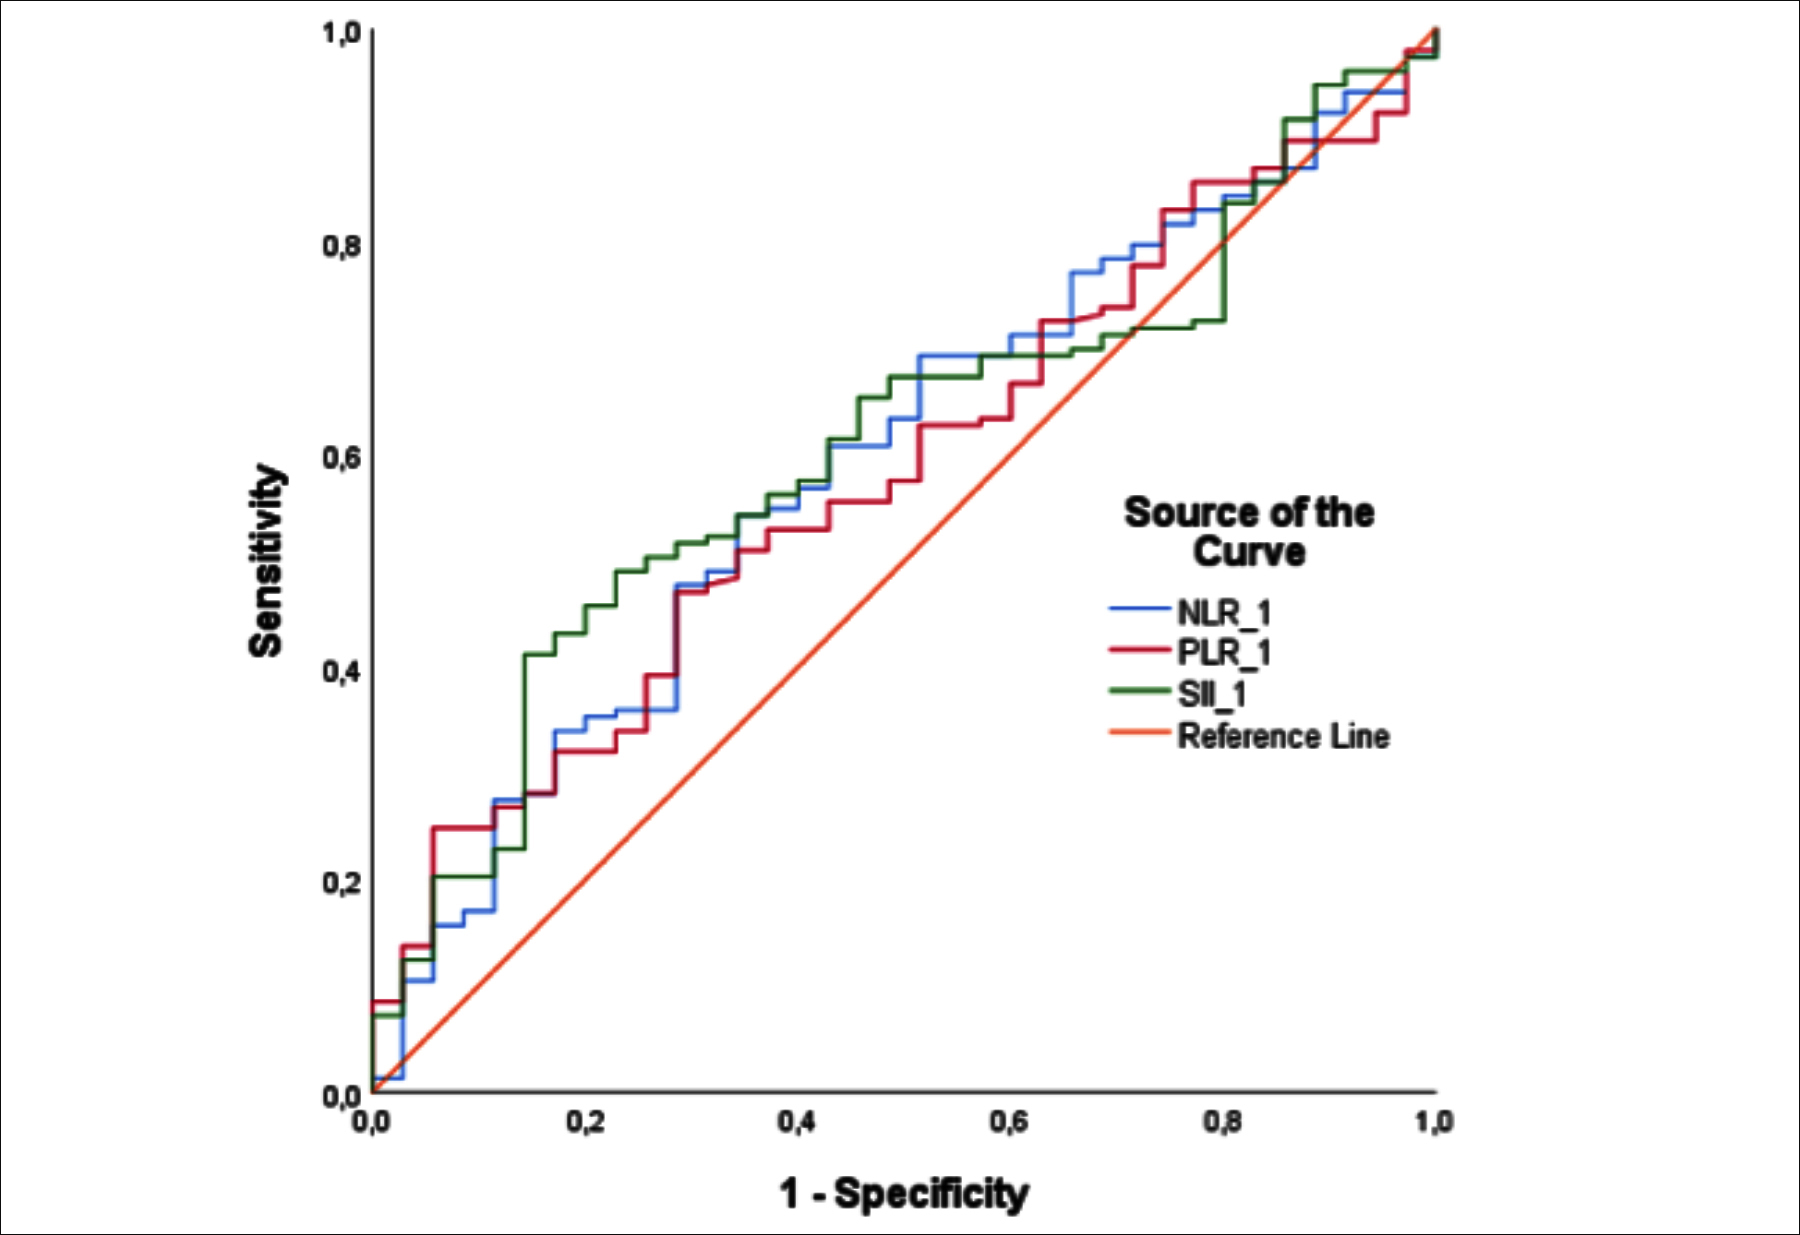 Figure 1: Receiver operator characteristic analysis of the percentage change in pre-CRT neutrophil‑to‑lymphocyte ratio, platelet‑to‑lymphocyte ratio and systemic immune-inflammatory index for prediction of pathological complete response. AUC, area under the curve.
Median values of the pCR and non-pCR groups for NLR-1 and PLR-1 in univariate analysis were 2.42 (1.96–3.20) vs. 2.82 (2.16–3.53) (p = 0.088) and 157.8 (129–199.5) vs. 168.5 (133.1–227.6) (p = 0.130). The cut-off values for NLR-1, PLR-1 and SII-1 determined by ROC analysis were 2.50, 160 and 748, respectively (Figure 1 and Table III). In the logistic regression analysis, which included NLR-1, PLR-1 and SII-1 with a p-value <0.200 in the univariate analysis, only SII-1 <748 was found to be an independent predictive factor of pCR (OR: 0.471, 95% CI; 0.224–0.991, p=0.047).
Median DFS was not reached when all patients were considered. The mean DFS was 62.0 ± 2.9 months, and the DFS rate at 60 months was 75%. DFS could not be calculated as no recurrence was observed in the pCR group. For the non-pCR group, median DFS could not be reached and the mean DFS was 59.5 ± 2.9 months. Median OS was not reached when all patients were considered. The mean OS was 68.1 ± 2.1 months, and the OS rate at 60 months was 74%. When the pCR and non-pCR groups were compared, median OS was not reached in both the groups and mean OS was 68.4 ± 4.5 months and 67.6 ± 2.3 months, respectively (p = 0.559).
DISCUSSION
In the present study, the relationship of pathological response to nCRT with systemic inflammatory markers and their changes during treatment in patients with LARC was evaluated. Among the evaluated inflammatory markers, only pre-treatment SII, i.e., SII for the period before neoadjuvant treatment, was an independent predictive factor of pCR.
One of the main goals of neoadjuvant therapy for LARC treatment is to provide a pathological complete response. Park et al. examined patients with LARC and compared patients with poor response to patients with pCR obtained using nCRT; they reported a significant difference in 5-year relapse-free survival in favour of patients with pCR (90.5% vs. 58.5%; p = 0.001).4 Similarly, according to the CAO/ARO/AIO-94 long-term follow-up results described by Fokas et al., 10-year cumulative incidence of distant metastases and DFS were superior in patients with pCR obtained using nCRT than in patients without pCR (p = 0.005 and p = 0.008, respectively).5 It may be useful to know the factors that predict treatment response to predict the prognosis and optimise the treatment in patients diagnosed with rectal cancer. Patients predicted to have a poor standard nCRT response can be evaluated within the scope of clinical studies.
In the search for an easily applicable and inexpensive marker for predicting the efficacy and prognosis of neoadjuvant therapy in patients with LARC, inflammatory markers were investigated. In this context, Dudani et al. found that baseline NLR and PLR were neither prognostic for OS and DFS nor predictive for pCR in their large-scale analysis of 1,237 patients.12 On the contrary, Lee et al. reported that platelet levels before nCRT and the changes in platelet levels and PLR after nCRT were associated with good treatment response.13 In another study, three weeks after the start of nCRT, high PLR and high PLR change rate (OR: 1.006, p = 0.011 and OR: 4.948, p <0.001, respectively) were reported to be predictive for pCR.14 However, there was no relationship between any of the rates of change in the evaluated inflammatory markers and pathological response in the present study. Additionally, the inflammatory markers measured during nCRT were not evaluated. Kim. et al. reported that NLR <2.0 and PLR <133.4 measured before nCRT were correlated with good tumour response (OR: 2.490, p = 0.008 and OR: 3.009, p < 0.001; respectively).15 In the present study, the p-value for basal NLR and PLR parameters was <0.2 in the univariate analysis performed for determining the relationship between inflammatory markers and pCR; however, no significant relationship was identified in the subsequent multivariate logistic regression analysis. Previous studies have reported on the relationship between PNI and survival in patients diagnosed with colorectal carcinoma, wherein this relationship had prognostic significance.9,16 However, to the best of authors’ knowledge, there is no study which evaluating the relationship between pathological response to nCRT and PNI in patients with rectal cancer. This relationship was evaluated; but no relationship was found between PNI measured at baseline or PNI measured after nCRT and the pathological response.
A recent study by Hu et al. included patients with hepatocellular carcinoma, wherein high SII was reported to be a strong prognostic indicator of poor oncological outcomes.17 Many studies have demonstrated that there is a close relationship between high SII and increased risk of distant metastasis, poor survival and poor prognosis in patients with colorectal cancer.8,18-21 Chen et al. reported that high preoperative NLR (>2.7), PLR (>210) and SII (>340) were associated with poor OS in a study on 1,383 patients with stage I–IV colorectal cancer, who had undergone radical surgery.22 In a multivariate Cox regression analysis in the same study, inflammatory markers SII (HR: 3.163, 95% CI: 2.616–3.824) and PLR (HR: 1.294 95% CI: 1.123–1.492) were found to be independent predictive factors of OS; and SII (HR: 2.717, 95% CI: 2.287–3.228) was found to be an independent predictive factor of DFS.22 Additionally, although SII was differential for OS and DFS in all TNM stages, NLR and PLR were not.22 Similarly, Yan et al. reported a relationship between high SII, NLR and PLR and poor survival in colorectal cancer patients that had undergone cytoreductive surgery for peritonitis carcinomatosis, and thereafter received chemotherapy; however, only SII was identified to be an independent predictive factor.23 In the present study, although not statistically significant, baseline NLR and PLR were lower in the pCR group. Moreover, baseline SII was significantly lower in the pCR group. In the multivariate analysis, <748 baseline SII was the only independent predictive factor for pCR. This finding is consistent with the findings of studies evaluating the relationship between SII and prognosis in patients with colorectal cancer.22,23
Tong et al. found an association of high SII, PLR and NLR and low PNI with poor OS in patients with stage III non-small cell lung cancer (NSCLC) who had undergone CRT.24 However, in their multivariate analysis, only SII and NLR were found to be significant prognostic indicators, wherein SII was relatively more effective in predicting the prognosis.24 Moreover, they reported that <660 baseline SII level was the only factor associated with CRT response and that there was no correlation between PLR, NLR and PNI and treatment response.24 In the present study, the factor with significant predictive value for pCR was baseline SII. In a study by Li et al. evaluated the relationship between pathological response to nCRT and systemic inflammatory markers in patients with LARC, basal carcino-embryogenic antigen, NLR, PLR, LMR, SII and PNI were associated with pCR according to univariate analysis; however, this relationship was not significant for SII and PNI according to multivariate analysis.25 Whereas, the findings of Li et al. are inconsistent with the results of studies showing that SII is a better marker than other inflammatory indices in predicting prognosis in CRC.22,23 and that SII is the only inflammatory marker predicting the CRT response in NSLC.24 Thus, the findings of the present study are more consistent with the findings of these studies than those of Li et al.
The main limitations of this study are the retrospective design and the lack of clearly defined cut-off values for the evaluated inflammatory markers, reported in the existing literature. However, the inclusion and exclusion criteria of this study are fairly stringent compared to most studies in the literature. Hence, it is believed that the data accurately reflects the relationship between pathological response to neoadjuvant therapy and inflammatory markers, which may be affected by many factors. Despite the best efforts, the authors may not be able to eliminate all confounding factors other than cancer that may affect inflammatory markers, which can be considered as another limitation. Although the main purpose of this study was to investigate the relationship between pCR and inflammatory markers, survival rate was also evaluated. However, it was not possible to comment evidently on this issue due to insufficient cases of recurrence and mortality.
CONCLUSION
Baseline SII might be an independent predictive factor for pCR in patients receiving NACRT with a diagnosis of LARC.
ETHICAL APPROVAL:
The medical records of these patients were reviewed retrospectively after obtaining the approval of the local Ethics Committee.
PATIENTS’ CONSENT:
As the study was designed retrospectively, data was collected from clinical archives after ethical approval.
CONFLICT OF INTEREST:
The authors declared no conflict of interest.
AUTHORS’ CONTRIBUTION:
EE: Conception and data analyses, interpretation of data, and drafting of manuscript.
YGA: Conception, data analyses and interpretation of data.
FY, AIG: Acquisition of data.
CK: Analysis and interpretation of data.
UYA: Conception and design, reviewed the paper and final approval.
REFERENCES
- National Comprehensive Cancer Network. Rectal (Version 6.2020) 2020 [last accesed on 02.12.2020. Available from: https://www.nccn.org/professionals/physician_gls/pdf/rectal.pdf.]
- Glynne-Jones R, Wyrwicz L, Tiret E, Brown G, Rödel C, Cervantes A, et al. Rectal cancer: ESMO clinical practice guidelines for diagnosis, treatment and follow-up. Ann Oncol 2017; 28(suppl_4):iv22-iv40. doi: 10.1093/annonc/mdx 224.
- Sauer R, Becker H, Hohenberger W, Rödel C, Wittekind C, Fietkau R, et al. Preoperative versus postoperative chemoradiotherapy for rectal cancer. N Engl J Med 2004; 351(17):1731-40. doi: 10.1056/NEJMoa040694.
- Park IJ, You YN, Agarwal A, Skibber JM, Rodriguez-Bigas MA, Eng C, et al. Neoadjuvant treatment response as an early response indictor for patients with rectal cancer. J Clin Oncol 2012; 1770-6. doi: 10.1200/JCO.2011.39.7901.
- Fokas E, Liersch T, Fietkau R, Hohenberger W, Beissbarth T, Hess C, et al. Tumor regression grading after preoperative chemoradiotherapy for locally advanced rectal carcinoma revisited: Updated results of the CAO/ARO/AIO-94 trial. J Clinical Oncol 2014; 32(15):1554-62. Doi: 10.1200/JCO.2013. 54.3769.
- Peng HX, Lin K, He BS, Pan YQ, Ying HQ, Hu XX, et al. Platelet-to-lymphocyte ratio could be a promising prognostic biomarker for survival of colorectal cancer: A systematic review and meta-analysis. FEBS Open Bio 2016; 6(7): 742-50. Doi: 10.1002/2211-5463.12083.
- Li MX, Liu XM, Zhang XF, Zhang JF, Wang WL, Zhu Y, et al. Prognostic role of neutrophil-to-lymphocyte ratio in colorectal cancer: A systematic review and meta-analysis. Int J Cancer 2014; 134(10):2403-13. doi: 10.1002/ijc. 28536.
- Dong M, Shi Y, Yang J, Zhou Q, Lian Y, Wang D, et al. Prognostic and clinicopathological significance of systemic immune-inflammation index in colorectal cancer: A meta-analysis. Ther Adv Med Oncol 2020; 12:1758835920937425. doi: 10.1177/1758835920937425.
- Jian-Hui C, Iskandar EA, Cai Sh I, Chen CQ, Wu H, Xu JB, et al. Significance of Onodera's prognostic nutritional index in patients with colorectal cancer: A large cohort study in a single Chinese institution. Tumour Biol 2016; 37(3): 3277-83. doi: 10.1007/s13277-015-4008-8.
- Lai S, Huang L, Luo S, Liu Z, Dong J, Wang L, et al. Systemic inflammatory indices predict tumor response to neoadjuvant chemoradiotherapy for locally advanced rectal cancer. Oncol Lett 2020; 20(3):2763-70. doi: 10.3892/ol.2020. 11812.
- Amin MB, Edge SB, Greene FL, Byrd DR, Brookland RK, Washington MK, et al. AJCC Cancer Staging Manual: Springer International Publishing 2018;
- Dudani S, Marginean H, Tang PA, Monzon JG, Raissouni S, Asmis TR, et al. Neutrophil-to-lymphocyte and platelet-to-lymphocyte ratios as predictive and prognostic markers in patients with locally advanced rectal cancer treated with neoadjuvant chemoradiation. BMC Cancer 2019; 19(1):664. doi: 10.1186/s12885-019-5892-x.
- Lee IH, Hwang S, Lee SJ, Kang BW, Baek D, Kim HJ, et al. Systemic inflammatory response after preoperative chemoradiotherapy can affect oncologic outcomes in locally advanced rectal cancer. Anticancer Res 2017; 37(3): 1459-65. doi: 10.21873/anticanres.11470.
- Lee JH, Song C, Kang SB, Lee HS, Lee KW, Kim JS. Predicting Pathological complete regression with haematological markers during neoadjuvant chemoradiotherapy for locally advanced rectal cancer. Anticancer Res 2018; 38(12): 6905-10. doi: 10.21873/anticanres.13067.
- Kim TG, Park W, Kim H, Choi DH, Park HC, Kim SH, et al. Baseline neutrophil-lymphocyte ratio and platelet-lymphocyte ratio in rectal cancer patients following neoadjuvant chemoradiotherapy. Tumori 2019; 105(5):434-40. doi: 10.1177/0300891618792476.
- Sun G, Li Y, Peng Y, Lu D, Zhang F, Cui X, et al. Impact of the preoperative prognostic nutritional index on postoperative and survival outcomes in colorectal cancer patients who underwent primary tumor resection: A systematic review and meta-analysis. Int J Colorectal Dis 2019; 34(4):681-9. doi: 10.1007/s00384-019-03241-1.
- Hu B, Yang XR, Xu Y, Sun YF, Sun C, Guo W, et al. Systemic immune-inflammation index predicts prognosis of patients after curative resection for hepatocellular carcinoma. Clin Cancer Res 2014; 20(23):6212-22. doi: 10.1158/1078- 0432.CCR-14-0442.
- Xie H, Yuan G, Huang S, Kuang J, Yan L, Ruan G, et al. The prognostic value of combined tumor markers and systemic immune-inflammation index in colorectal cancer patients. Langenbecks Arch Surg 2020; 405(8):1119-30. doi: 10.1007/s00423-020-01963-3.
- Xie QK, Chen P, Hu WM, Sun P, He WZ, Jiang C, et al. The systemic immune-inflammation index is an independent predictor of survival for metastatic colorectal cancer and its association with the lymphocytic response to the tumor. J Transl Med 2018; 16(1):273. doi: 10.1186/s12967-018- 1638-9.
- Lu Y, Xin D, Wang F. Predictive Significance of preoperative systemic immune-inflammation index determination in postoperative liver metastasis of colorectal cancer. Onco Targets Ther 2019; 12:7791-9. doi: 10.2147/OTT.S223419
- Yatabe S, Eto K, Haruki K, Shiba H, Kosuge M, Ohkuma M, et al. Signification of systemic immune-inflammation index for prediction of prognosis after resecting in patients with colorectal cancer. Int J Colorectal Dis 2020; 35(8):1549-55. doi: 10.1007/s00384-020-03615-w.
- Chen JH, Zhai ET, Yuan YJ, Wu KM, Xu JB, Peng JJ, et al. Systemic immune-inflammation index for predicting prognosis of colorectal cancer. World J Gastroenterol 2017; 23(34):6261-72. doi: 10.3748/wjg.v23.i34.6261.
- Yan Q, Ertao Z, Zhimei Z, Weigang D, Jianjun P, Jianhui C, et al. Systemic immune-inflammation index (SII): A more promising inflammation-based prognostic marker for patients with synchronic colorectal peritoneal carcinomatosis. J Cancer 2020; 11(18):5264-72. doi: 10.7150/jca.46446.
- Tong YS, Tan J, Zhou XL, Song YQ, Song YJ. Systemic immune-inflammation index predicting chemoradiation resistance and poor outcome in patients with stage III non-small cell lung cancer. J Transl Med 2017; 15(1):221. doi: 10.1186/s12967-017-1326-1.
- Li A, He K, Guo D, Liu C, Wang D, Mu X, et al. Pretreatment blood biomarkers predict pathologic responses to neo-CRT in patients with locally advanced rectal cancer. Future Oncol 2019; 15(28):3233-42. doi: 10.2217/fon-2019-0389.