Relationship between Abdominal Aortic Calcification, Abdominal Adiposity, and Liver Density
By Cansu Ozturk1, Ozlem Gungor1, Veysel Kaplanoglu1, Merve Kasikci2, Selma Uysal Ramadan1Affiliations
doi: 10.29271/jcpsp.2020.12.1245ABSTRACT
Objective: To identify any relationship among visceral adipose tissue area (visceral FA), liver density (liver HU), psoas muscle area (psoas MA), waist circumference (WC) and the presence and severity of abdominal aortic calcific atherosclerosis (AAC).
Study Design: Cross-sectional descriptive study.
Place and Duration of Study: Ankara Kecioren Training and Research Hospital, Ankara, Turkey, from January to February 2019.
Methodology: This study included 316 patients, who had CT performed for urolithiasis investigation. For all patients, the presence and grade of AAC was recorded. Then, liver HU, spleen density (spleen HU), psoas MA, visceral FA, total abdominal fat area (total FA), subcutaneous fat area (subcutaneous FA), WC and hip circumference (HC) were measured on a workstation.
Results: AAC was present in 127 patients (40.2%). The age, visceral FA, total FA, visceral FA/total FA ratio, WC and WC/HC ratio of patients with AAC were significantly higher than for patients without AAC (p <0.05). Psoas MA was significantly lower in patients with AAC (p <0.05). The cut-off value of visceral FA for the prediction of AAC was 131 cm2. The risk for AAC was 4.5 times higher in the group with visceral FA >131 cm2 (p <0.001). There were significant correlations between AAC grade and liver HU and spleen HU (p = 0.002 and p = 0.001, respectively). However, there was no significant correlation between AAC grade and liver HU/spleen HU ratio (p = 0.741).
Conclusion: Psoas muscle area, visceral adiposity and waist circumference can be used to predict abdominal aortic calcification.
Key Words: Visceral adipose tissue, Subcutaneous adipose tissue, Fatty liver.
INTRODUCTION
Obesity is a serious health issue due to its high morbidity and mortality. To evaluate the severity of obesity and predict secondary cardiovascular events, methods such as body mass index (BMI), waist circumference/hip circumference ratio (WC/HC) and body fat area measurements are used.1 Many studies have stated that regional adipose tissue distribution and ectopic adipose tissue accumulation, such as visceral and subcutaneous, are key factors for explaining the relationship between adiposity and cardiometabolic risk; and visceral adipose tissue-induced endocrine and inflammatory factors play a role in the development of atherosclerosis.2
It has been shown that patients with a normal BMI but central obesity have higher cardiovascular mortality than patients with a high BMI (obese patients) without central obesity.3 Artery calcification, visible on the abdominal aortic or coronary artery, is an indicator of future cardiovascular disease, and it is associated with traditional cardiovascular risk factors.4,5
Fatty liver has a wide spectrum, ranging from simple hepatosteatosis to steatohepatitis.6 It is the most common liver disease in Western countries, with an incidence ranging from 17%-46%.6 Although fatty liver and visceral adipose tissue etiology are similar, there are opinions in the literature that fatty liver can be used as a cardiometabolic risk factor independent of visceral steatosis.7 In a meta-analysis investigating the effect of liver density (liver HU) on subclinical atherosclerosis in coronary arteries,8 the prevalence of CAC was increased in those with fatty livers. However, in another study investigating atherosclerotic calcification in eight separate vascular beds, including the abdominal aorta, no significant relationship was found between AAC and liver HU.9 Therefore, this issue is highly controversial.
There is evidence that low muscle mass may be associated with metabolic syndrome, fatty liver, major cardiovascular events, and even mortality.10 However, there are limited data on the relationship between low muscle mass and subclinical atherosclerosis. In the literature, the relationships between atherosclerosis and abdominal obesity, fatty liver and low muscle mass are controversial.
For this reason, this study aimed to reveal the relationships between visceral adipose tissue, liver HU and psoas MA with the presence and severity of AAC.
METHODOLOGY
This retrospective study included 344 patients, who underwent non-contrast abdominal CT in the prone position at Ankara Kecioren Training and Research Hospital, Ankara, Turkey, between January and February 2019. The inclusion criteria of the participants were CT scanning to investigate urolithiasis (it has optimal technical quality and FOV). Of the 344 patients, 28 were excluded from the study (<18 years old with cachexia and motion artefact) and the remaining 316 were included. The Hospital’s Institutional Review Board approved the study. Condition of informed consent was waived because this study was retrospective.
All the CT examinations were obtained by a 16-detector MSCT device (Somatom Emotion 16; Siemens) with 120 kVp, 400 mAs, 200–270 mm FOV and a slice thickness of 0.5 mm. CT imaging started from directly above the diaphragm and finished at the level of the greater trochanters. CT scan analysis was performed using a workstation (vitrea, vital images; Canon Group Company, Minnetonka, MN).
For the detection of abdominal obesity, total abdominal fat area (total FA), subcutaneous fat area (subcutaneous FA), visceral fat area (visceral FA), WC and HC were used for the evaluation of other ectopic adipose tissue areas: liver HU, spleen density (spleen HU) and psoas muscle area (psoas MA), which were automatically measured for all patients.
For the detection of atherosclerosis, the presence or absence of calcified plaque in the abdominal aorta (AAC) and iliac arteries (IAC) was recorded. Then, AAC was graded according to methods used in previous studies.11,12
The abdominal fat area was measured between the L4 and L5 vertebrae levels (13) using special workstation software by a single radiologist (CO). The threshold value for measuring adipose tissue was −70 to −130 HU. Visceral FA and subcutaneous FA segmentation were automatically separately obtained using the workstation software (Figure 1).
A method described in previous studies was modified and used for AAC grading.11,12 The abdominal aorta was evaluated between the L1 - L4 vertebrae levels. Each vertebral level was divided and scored in four quadrants in the axial plane, and the affected vertebral length was scored between 0 and 3 (0: no calcification, 1: 1/3 of vertebral length affected, 2: 2/3 of vertebral length affected and 3: whole vertebrae length affected) in the longitudinal plane (Figure 2). The total ACC score for each vertebra level ranged from 0 to 12, with a minimum total score of 0 and a maximum total score of 48.
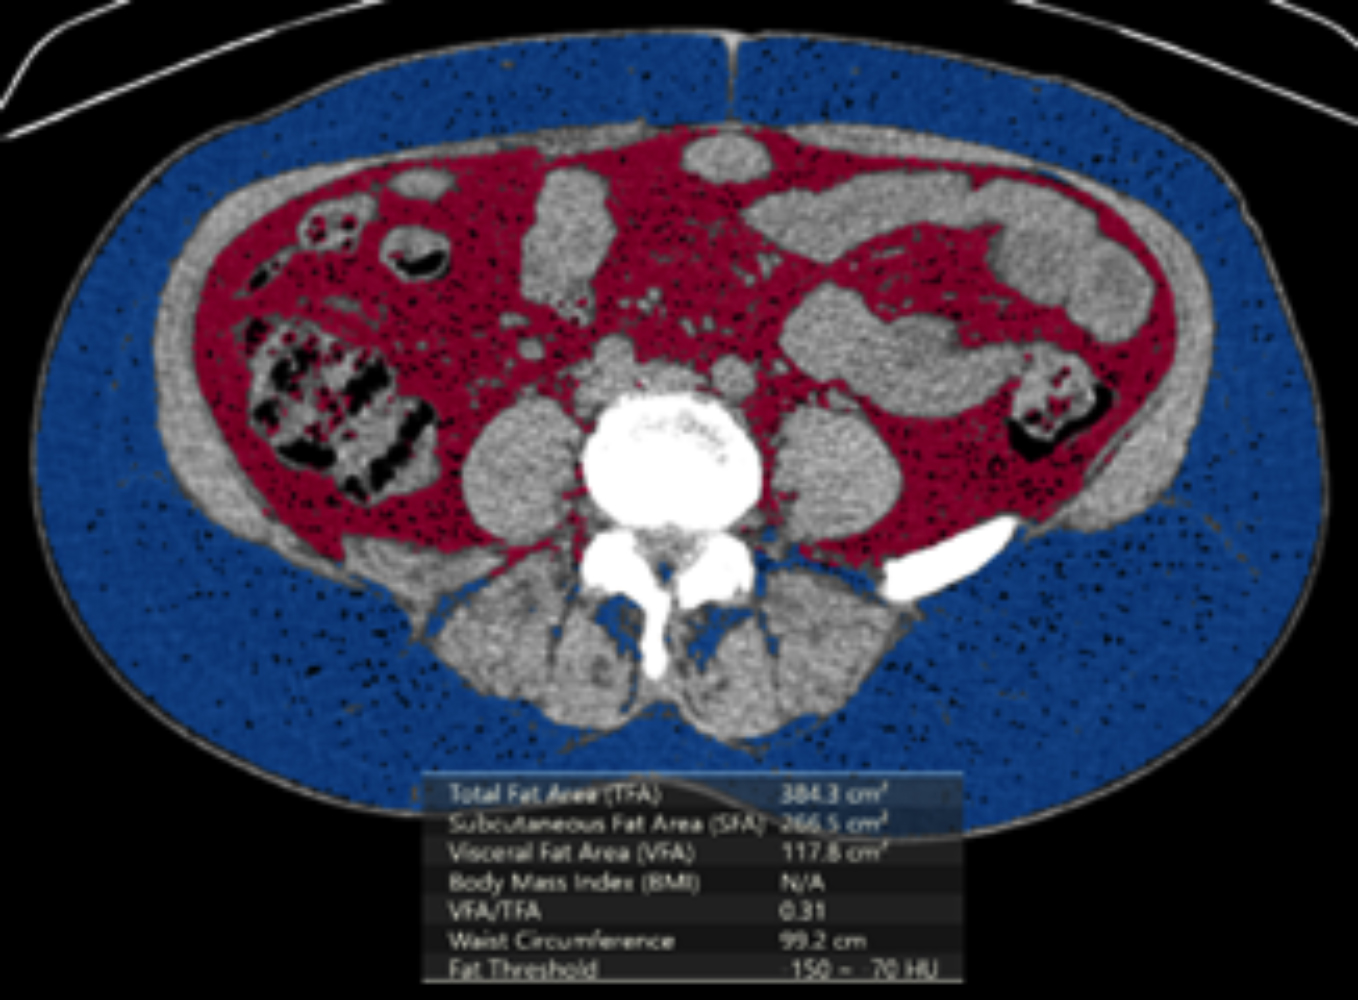 Figure 1: Total FA/Visceral FA (pink colored)/ subcutaneous FA (blue colored) measurements.
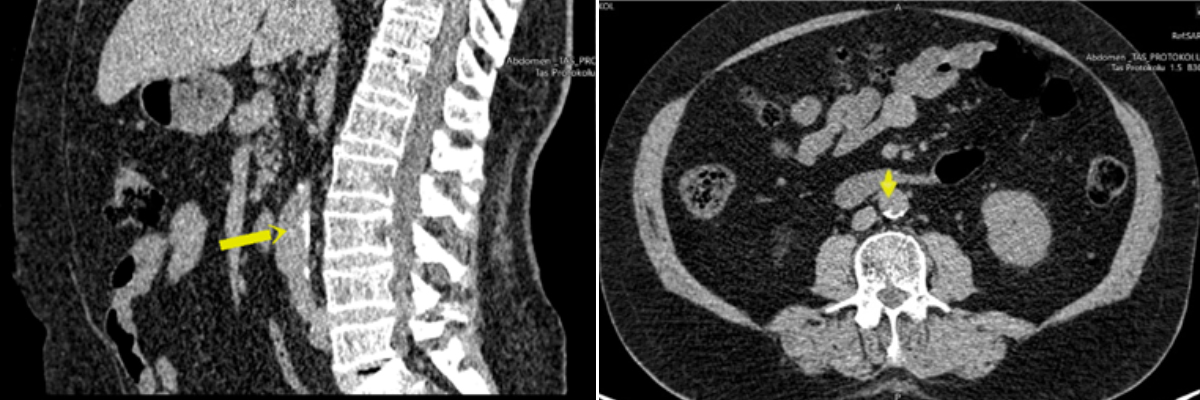 Figure 2: AAC measurements.
As described in previous studies,7,13 in this study, the measurement of liver HU was performed at the T12-L1 intervertebral disc space level on segment 7-8 in the right liver lobe by a non-contrast CT scan. A 100 mm2 ROI was used for the measurement of liver HU and the mean of three consecutive measurements was used. During ROI placement, focal liver lesions and vascular structures were avoided. Spleen HU measurements were performed using the same level and method as the liver HU. Liver HU values ≤40 or a liver HU/Spleen HU ratio <1 were accepted as fatty liver.7,9
Psoas MA measurements were performed using a freehand ROI at the L4 vertebrae level. The area within the region drawn from the outer border of the psoas muscle was automatically calculated in mm2. WC and HC measurements were automatically performed on the workstation during abdominal fat area measurement.
The qualitative variables were descriptive measures, such as number and percentage, and the quantitative variables were mean, standard deviation (S.D), minimum and maximum. To priorly examine the difference between two independent groups, the distribution of the variables was examined by the Kolmogorov-Smirnov normality test and histograms, box-plots and Q-Q plots. The independent samples t-test was used for the normally distributed variables. Mann-Whitney U-test was used for analyses and performed only for under the age of 40. Since the distribution of the AAC grade was quite skewed, the relationships between AAC grade and the other numerical variables were examined by taking Spearman’s Rho correlation coefficients into consideration. A logistic regression model was established for the two-state dependent variable. To determine the threshold value, the significance of the area under the ROC curve was examined. The sensitivity and specificity for all possible threshold values were evaluated. The optimum threshold value was estimated by the Youden Index. In this study, the significance level was set at 0.05. All statistical analyses were performed using IBM spss statistics software, version 24.0 (IBM Corp, Armonk, NY).
RESULTS
For the detection of abdominal obesity; total FA, subcutaneous FA, visceral FA, WC, HC were used. For evaluation of other ectopic adipose tissue areas; liver HU and spleen HU, psoas MA, were measured for all patients automatically.
For the detection of atherosclerosis, the presence or absence of AAC and IAC was recorded.
The study population comprised 162 males (51.3%) and 154 females (48.7%), with a mean age of 48.6 ± 15.3 (20-83) years. Mean values of visceral FA, subcutaneous FA, total FA, WC, HC, psoas MA, liver HU, spleen HU, AAC, visceral FA/total FA, WC/HC, liver HU/spleen HU ratios were 138.6 ± 70.6 (7-399) cm2, 220.6 ± 116.7 (20-1258) cm2, 355.5 ± 147.3 (45-828) cm2, 99.9 ± 12.5 (65-132) cm, 107.2 ± 11.0 (72-152) cm, 1191.1 ± 430.4 (173-2316) mm2, 50.7 ± 11.6 (-5-73) HU, 42.4 ± 5.4 (22-55) HU, 4.6 ± 8.7 (0-44), 0.39 ± 0.12 (0.09-0.70), 1.04 ± 1.33 (0.74-20.43), 1.21 ± 0.28 (-0.12-2.14), respectively. AAC, IAC and fatty liver were present in 127 (40.2%), 120 (37.8%) and 48 (15.2%) participants, respectively. The mean age, visceral FA, visceral FA/total FA and WC measurements of the participants with AAC were significantly higher than the participants without AAC (p <0.001; p <0.001; p <0.001; p <0.001, respectively, (Table I). Psoas MA (p = 0.009) was significantly lower and total FA cm2 (p = 0.017) was significantly higher in the AAC group (Table I).
Table I: Characteristics of with/without atherosclerotic aortic calcification.
|
|
AAC |
p-values |
|
|
Negative Mean ± SD |
Positive Mean ± SD |
||
|
Patient age (years) |
40.31 ±11.78 |
60.83 ±11.18 |
<0.001 |
|
Visceral FA (cm2) |
119.95 ±69.34 |
166.39 ±63.08 |
<0.001 |
|
Total FA (cm2) |
339.30 ±153.91 |
379.73 ±133.98 |
0.017 |
|
Visceral FA/Total FA |
0.35 ± 0.12 |
0.44 ±0.10 |
<0.001 |
|
WC (cm) |
97.64 ±13.28 |
103.17 ±10.61 |
<0.001 |
|
HC (cm) |
107.22 ±11.45 |
107.09 ±10.36 |
0.918 |
|
W/H ratio |
1.08 ±1.72 |
0.96 ±0.06 |
0.343 |
|
Psoas MA (mm2) |
1242.89 ±440.30 |
1114.13 ±404.70 |
0.009 |
|
Mean liver HU |
51.61 ±12.19 |
49.24 ±10.61 |
0.075 |
|
Mena spleen HU |
43.26 ±4.94 |
41.01 ±5.70 |
<0.001 |
|
Liver HU/Spleen HU ratio |
1.20 ±0.28 |
1.22 ±0.30 |
0.514 |
Psoas MA (male: 1497.46 ± 350.61 mm2, female: 868.90 ± 219.31 mm2; p <0.001); and visceral FA/total FA (male: 0.43 ± 0.11, female: 0.33 ± 0.11; p < 0.001) were significantly higher in males.
The mean visceral FA of the atherosclerotic group for both genders was significantly higher than in those without AAC (male with AAC: 165.99 ± 65.24 cm2, male without AAC: 125.94 ± 65.85 cm2; p <0.001; and female with AAC: 166.90 ± 60.90 cm2, female without AAC: 114.28 ± 72.37 cm2; p <0.001, respectively).
While there was no difference between males and females for visceral FA (male: 143.24 ± 68.35 cm2, female: 133.75 ± 72.75 cm2; p = 0.233), subcutaneous FA was significantly higher in females than males (male: 189.11 ± 112.18 cm2, female: 253.63 ± 112.39 cm2; p <0.001). The relationship between visceral FA and AAC grade was more potent in females than in males (female: rs = 0.400; p <0.001 and male: rs = 0.31; p <0.001).
ROC analysis was performed to investigate whether a threshold value for visceral FA could be determined in terms of the presence of AAC. As a result of the ROC analysis, the area under the ROC curve was found to be 0.705 (95% CI: 0.648–0.762, p <0.001). When the threshold value was detected as 131 cm2 for visceral FA by the Youden Index, the sensitivity and specificity for AAC were 74% and 61%, respectively. There were 149 (47.2%) cases that had visceral FA <131 cm2, and 167 (52.8%) cases had visceral FA >131 cm2.
In the univariate logistic regression analysis, the risk of the presence of AAC was 23.6 times high >40 years age group (p <0.001). Although psoas MA (p = 0.010), total FA (p = 0.018), visceral FA/total FA (p <0.001) and WC (p <0.001) were found to be significant, liver HU was not significant for the presence AAC.
A multivariate logistic regression model was established for age and visceral FA. The risk of AAC was nearly 17 times higher in patient >40 years of age than in those <40 years of age (p <0.001). Patients with a visceral FA >131 cm2 had two times the risk of having ACC than patients with <131 cm2.
AAC grade was positively correlated with patient age (rs = 0.695; p <0.001), visceral FA (rs = 0.355; p <0.001), visceral FA/total FA (rs = 0.359; p <0.001) and WC (rs = 0.236; p <0.001). There was a significant but low level of correlation between liver HU, spleen HU and AAC grade (rs = −0.177; p = 0.002 and rs = −0.186; p = 0.001, respectively). There was no significant correlation between the liver HU/spleen HU ratio and AAC grade (rs = −0.019; p = 0.741). In addition, there was a positive correlation between the AAC positive group and WC/HC (rs = 0.239; p = 0.007).
DISCUSSION
Regional fat distribution is correlated with obesity-related mortality and morbidity.5,14 The most crucial cause of obesity-related morbidity and mortality is atherosclerosis and atherosclerosis-related diseases. As is known, atherosclerosis is considered a systemic disease.15 For this reason, it is thought that the atherosclerotic process that starts in a vascular bed may also be an indicator of atherosclerosis in other vascular beds, such as coronary and cranial. In this study, the presence of AAC and the grade of abdominal obesity markers (such as visceral FA and WC) and other ectopic adipose tissue areas (such as liver HU and psoas MA) were investigated. As the abdominal visceral FA and WC increased, it was shown that the frequency of AAC and IAC and AAC grade were directly proportional (p >0.001), but liver HU was unrelated, although it could have a similar etiology. A low psoas MA was also found to be positively associated with the presence of AAC and IAC.
Some authors have argued that the ratio of abdominal obesity (measured by WC and WC/HC) to the volume of total body fat plays a more significant role in obesity-related diseases.3 In this study, the presence of atherosclerosis was found to be associated with WC (p <0.001), and atherosclerosis was more severe with increasing WC (p <0.001). The distinction between visceral and subcutaneous adipose tissue cannot be made by digital or manual measurements.2,3 For this reason, although there was a relationship between WC and atherosclerosis in this study, this can only be interpreted as abdominal obesity. However, when abdominal obesity components were separately evaluated as either visceral or subcutaneous, we only found a relationship between visceral FA and atherosclerosis. In literature, a negative relationship has been reported among subcutaneous FA, WC, BMI, volume of total body fat, and coronary/extra coronary atherosclerotic plaque burden.14 This may be due to endocrine and inflammatory factors originating from visceral adipose tissue inducing the development of atherosclerosis.
Ryo et al. stated that those with visceral obesity have higher metabolic properties (triglyceride level, glucose level, etc.), and decreasing visceral FA may play a preventive role in obesity-related diseases.15 However, the results of studies investigating the relationship between visceral FA and atherosclerotic calcification in both the abdominal aorta and other vascular beds are controversial. Some studies have shown that visceral FA or the visceral FA/subcutaneous FA ratio are related to the atherosclerotic diseases of various vascular beds.1,16,17 In contrast, some studies have shown that visceral FA is not related to atherosclerotic diseases in various vascular beds.5,7,18,19 In this study, the amount of visceral FA in the group with AAC was higher than those without AAC, having detected the correct proportion between visceral FA and AAC (0.001).
Deurenberg-Yap et al. showed that the East Asian population tends to have more visceral FA than the European population with the same BMI.20 Different thresholds have been determined for different ethnic groups to predict atherosclerosis; for example, 80 cm2 for the Chinese population and 100 cm2 for the Japanese population.21,22 In this study, the threshold value for predicting AAC was found to be 131 cm2 (74% sensitivity, 61% specificity), the presence of AAC was found to be 4.5 times higher in patients with visceral FA above this value.
Regional fat distribution varies between genders; it is frequently more visceral in males and more subcutaneous in females.23 In this study, in individuals <40 years (p = 0.010) and >40 years (p < 0.001), subcutaneous FA was found to be significantly higher in females than in males; whereas, visceral FA measurements did not differ between genders in both age groups (p = 0.054 and p = 0.517, respectively). In this study, it is thought that this might be due to a non-homogeneous distribution of BMI; but BMI could not be determined due to this being a retrospective study. Additionally, Ditomasso et al.’s, study of different vascular beds, including the abdominal aorta, found the relationship between visceral FA and atherosclerotic calcification to be stronger in females than in males.24 Similarly, in the present study, the correlation coefficient between visceral FA and atherosclerosis was higher in females than in males.
Data on the relationship between liver HU and calcific atherosclerosis vary in the literature. In a meta-analysis investigating the effect of liver HU on subclinical atherosclerosis in coronary arteries,23 the prevalence of CAC was increased in those with fatty liver. Remigio-Baker et al.24 showed that fatty liver was associated with AAC, and this relationship was affected by both ethnicity and gender. However, in the study of, Liu et al.7 although they found a relationship between liver HU and CAC, no relationship was found for AAC. Similarly, in another study investigating atherosclerotic calcification in eight separate vascular beds, including the abdominal aorta, no significant relationship was found between AAC and liver HU.11 In this study, no relationship was found between liver HU and AAC, for both the evaluation of all cases included in this study and the evaluation of cases with a HU density ≤40 (p = 0.077). In a study examining the effect of muscle mass on atherosclerosis,10 low muscle mass was shown to be associated with coronary atherosclerosis. Similarly, in this study, psoas MA was statistically significantly lower in the group with AAC.
This study has some limitations. First, although it is found a relationship between visceral FA and AAC, because this was not the main subject of the study, the effect of reducing visceral FA on AAC could not be demonstrated due to the retrospective design of the study. Second, the current study’s population did not include different ethnic groups. Data in the literature suggest that the relationships between AAC and fatty liver and visceral fat may be affected by ethnicity. Third, other atherosclerotic risk factors, such as smokers’ blood lipid levels, were not evaluated. Therefore, further prospective studies involving different ethnic groups and examining different vascular bed atherosclerosis, such as cardiac and cranial, are needed.
CONCLUSION
Fatty liver is not significantly associated with AAC, and the effects of subcutaneous and visceral fattening on atherosclerosis are different for the evaluation of abdominal obesity; visceral fattening may be more related to AAC. It was also shown that psoas muscle mass was decreased in the group with AAC.
Therefore, an indication of the visceral or subcutaneous predisposition of abdominal obesity in CT examinations; and the evaluation of psoas muscle mass can be guides for atherosclerotic risk management and treatment planning.
ETHICAL APPROVAL:
This study was conducted in compliance with the ethical principles according to the Declaration of Helsinki, and it was approved by the local Institutional Review Board (No. 2019/47).
PATIENTS’ CONSENT:
Because this study was retrospective, the patients’ consent was waived.
CONFLICT OF INTEREST:
The authors declared no conflict of interest.
AUTHORS’ CONTRIBUTION:
CO, OG, VK, MK, SUR: Conceived the study design, involved in data collection, performed the statistical analysis, interpreted data and prepared the manuscript draft.
All the authors critically reviewed the final version of the manuscript and approved it for publication.
REFERENCES
- Higuchi S, Kabeya Y, Kato K. Visceral-to-subcutaneous fat ratio is independently related to small and large cerebrovascular lesions even in healthy subjects. Atherosclerosis 2017; 259:41-5. doi: 10.1016/j.athero sclerosis.2017.03.001.
- Mathieu P, Lemieux I, Despres JP. Obesity, inflammation, and cardiovascular risk. Clin pharmacol Therapeutics 2010; 87(4):407-16. doi.org/10.1038/clpt.2009.311.
- Sahakyan KR, Somers VK, Rodriguez-Escudero JP, Hodge DO, Carter RE, Sochor O, et al. Normal-weight central obesity: Implications for total and cardiovascular mortality. Ann Internal Med 2015; 163(11):827-35. doi: 10.7326/ M14-2525.
- Ong KL, McClelland RL, Rye KA, Cheung BM, Post WS, Vaidya D, et al. The relationship between insulin resistance and vascular calcification in coronary arteries, and the thoracic and abdominal aorta: The multi-ethnic study of atherosclerosis. Atherosclerosis 2014; 236(2):257-62. doi: 10.1016/j.atherosclerosis.
- Kuipers AL, Zmuda JM, Carr JJ, Terry JG, Nair S, Cvejkus R, et al. Association of ectopic fat with abdominal aorto-illiac and coronary artery calcification in african ancestry men. Atherosclerosis 2017; 263:198-204. doi: 10.1016/j. atherosclerosis.
- European Association for the Study of the Liver (EASL); European Association for the Study of Diabetes (EASD); European Association for the Study of Obesity (EASO). EASL-EASD-EASO Clinical practice guidelines for the management of non-alcoholic fatty liver disease. J Hepatol 2016; 64(6):1388-402. doi: 10.1007/s00125- 016-3902-y.
- Liu J, Musani SK, Bidulescu A, Carr JJ, Wilson JG, Taylor HA, et al. Fatty liver, abdominal adipose tissue and atherosclerotic calcification in African Americans: The jackson heart study. Atherosclerosis 2012; 224(2):521-5. doi: 10.1016/j.atherosclerosis.2012.07.042.
- Kapuria D, Takyar VK, Etzion O, Surana P, O'Keefe JH, Koh C. Association of hepatic steatosis with subclinical atherosclerosis: Systematic review and meta-analysis. Hepatol Commun 2018; 2(8):873-83. doi: 10.1002/ hep4.1199.
- Koo BK, Allison MA, Criqui MH, Denenberg JO, Wright CM. The association between liver fat and systemic calcified atherosclerosis. J Vascular Surg 2020; 71(1):204-11. doi: 10.1016/j.jvs.2019.03.044. doi: 10.1016/j.jvs.2019.03.044.
- Ko BJ, Chang Y, Jung HS, Yun KE, Kim CW, Park HS, et al. Relationship Between Low Relative Muscle Mass and Coronary Artery Calcification in Healthy Adults. Arterio-sclerosis Thromb Vascul Biol 2016; 36(5):1016-21. doi: 10.1161/ATVBAHA.116.307156.
- Kauppila LI, Polak JF, Cupples LA, Hannan MT, Kiel DP, Wilson PW. New indices to classify location, severity and progression of calcific lesions in the abdominal aorta: A 25-year follow-up study. Atherosclerosis 1997; 132(2):245-50. doi: 10.1016/s0021-9150(97)00106-8.
- Wilson PW, Kauppila LI, O'Donnell CJ, Kiel DP, Hannan M, Polak JM, et al. Abdominal aortic calcific deposits are an important predictor of vascular morbidity and mortality. Circulation 2001; 103(11):1529-34. doi: 10.1161/01. cir.103.11.1529.
- Davidson LE, Kuk JL, Church TS, Ross R. Protocol for measurement of liver fat by computed tomography. J Appl Physiol 2006; 100(3):864-8. doi: 10.1152/japplphysiol. 00986.2005.
- Rodriguez-Granillo GA, Reynoso E, Capunay C, Carpio J, Carrascosa P. Pericardial and visceral, but not total body fat, are related to global coronary and extra-coronary atherosclerotic plaque burden. Int J Cardiol 2018; 260:204-10. doi: 10.1016/j.ijcard.2018.01.106.
- Ryo M, Kishida K, Nakamura T, Yoshizumi T, Funahashi T, Shimomura I. Clinical significance of visceral adiposity assessed by computed tomography: A japanese perspective. World J Radiol 2014; 6(7):409-16. doi: 10.4329/wjr.v6.i7.409.
- Wang Y, Ma X, Zhou M, Zong W, Zhang L, Hao Y, et al. Contribution of visceral fat accumulation to carotid intima-media thickness in a Chinese population. International J Obesity 2012; 36(9):1203-8. doi: 10.1038/ijo.2011.222.
- Hiuge-Shimizu A, Kishida K, Funahashi T, Ishizaka Y, Oka R, Okada M, et al. Reduction of visceral fat correlates with the decrease in the number of obesity-related cardiovascular risk factors in Japanese with Abdominal Obesity (VACATION-J Study). J Atherosclerosis Thrombosis 2012; 19(11):1006-18. doi: 10.5551/jat.12963.
- Kim DJ, Bergstrom J, Barrett-Connor E, Laughlin GA. Visceral adiposity and subclinical coronary artery disease in elderly adults: Rancho bernardo study. Obesity (Silver Spring, Md) 2008; 16(4):853-8. doi: 10.1038/oby.2008.15.
- Terry JG, Shay CM, Schreiner PJ, Jacobs Jr, Sanchez OA, Reis JP, et al. Intermuscular adipose tissue and subclinical coronary artery calcification in midlife: The cardia study (coronary artery risk development in young adults). Arterioscle Thromb Vascul Biol 2017; 37(12):2370-8. doi: 10.1161/ATVBAHA.117.309633.
- Deurenberg-Yap M, Schmidt G, van Staveren WA, Deurenberg P. The paradox of low body mass index and high body fat percentage among Chinese, Malays and Indians in Singapore. Int J Obes Relat Metabol Disord 2000; 24(8):1011-7. doi: 10.1038/sj.ijo.0801353.
- Bao Y, Lu J, Wang C, Yang M, Li H, Zhang X, et al. Optimal waist circumference cutoffs for abdominal obesity in Chinese. Atherosclerosis 2008; 201(2):378-84. doi: 10.1016/j.atherosclerosis.2008.03.001.
- New criteria for 'obesity disease' in Japan. Circulation journal: Official J Jap Circul Societ 2002; 66(11):987-92.
- Blaak E. Gender differences in fat metabolism. Curr Opin Clin Nutrit Metabol Care 2001; 4(6):499-502. doi: 10.1097/ 00075197-200111000-00006.
- Ditomasso D, Carnethon MR, Wright CM, Allison MA. The associations between visceral fat and calcified atherosclerosis are stronger in women than men. Atherosclerosis 2010; 208(2):531-6. doi: 10.1016/j. atherosclerosis.2009.08.015.