Predictive Value of Markers of Adiposity in Carpal Tunnel Syndrome: A Clinical and Electrophysiological Evaluation
By Syed Shahid Habib1, Mohammed H. Alanazy2Affiliations
doi: 10.29271/jcpsp.2020.08.828ABSTRACT
Objective: To determine the association of total and segmental body composition adiposity indices with electrophysiological indicators of CTS.
Study Design: Observational cross-sectional study.
Place and Duration of Study: Departments of Medicine and Clinical Physiology at King Saud University Medical City, King Saud University, Riyadh from August 2018 to December 2019.
Methodology: Total and segmental body composition analyses were performed by a bio-impedance body composition analyser. All the patients were grouped according to body mass index [BMI], total body fat % [TBF%], total fat mass [TFM], arm fat % [AF%], arm fat mass [AFM], and visceral fat rating [VFR] scores. Nerve conduction studies (NCS) were performed according to the standard protocols.
Results: CTS clinical severity score and CTS by NCS correlated significantly with BMI, TBF%, TFM, VFR, AF% and AFM. In ROC analysis, it was revealed that adiposity indices including BMI, TFM, VFR and AFM were significant predictors of abnormal NCS with area under the curve (AUC) of 0.824, 0.795, 0.795, and 0.803, respectively. VFR was a significant independent predictor of CTS severity (β coefficient=0.613, p<0.001) and delayed median nerve latency (β coefficient=0.317, p=0.017).
Conclusion: Total and segmental body composition adiposity indicators are significantly associated with clinical severity of CTS and electrophysiological markers; especially, visceral adiposity. Large scale studies are required to explore the true predictive value of body composition in CTS.
Key Words: Body mass index, Body composition, Adipose tissue, Body fat distribution, Carpal tunnel syndrome, Nerve conduction, Median nerve entrapment, Visceral fat, Bioelectrical impedance, ROC analysis.
INTRODUCTION
Carpal tunnel syndrome (CTS) is one of the most commonly observed compressive mononeuropathies in the general population,1,2 resulting from compression of the median nerve in the carpal tunnel. Obesity is a well-known modifiable risk factor for CTS because of its association with increased pressure in the limited tissue space in the carpal tunnel.3,4 CTS is five times more common in women than men with highest incidence between 30-60 years. Independent risk factors for CTS include obesity, feminine gender, and square shaped wrists.5,6
Nerve conduction studies (NCS) are commonly used in cases of suspected CTS to confirm and grade the severity of median neuropathy at the wrist and uncover other neuropathic conditions.7 CTS remains idiopathic in almost half of the patients, and no specific causative factor has been found. Occupational conditions requiring repetitive wrist motions are among the common etiologies.8 Apart from these secondary causative factors, there may be anatomical abnormalities in bone structure, structural disorders due to traumatic injuries, occupational-related repeated microtraumas, and systemic illnesses such as diabetes mellitus, hypothyroidism, rheumatic problems, amyloidosis, and cancer.9
However, it is now well known that BMI is a poor index of adiposity, and that sometimes it may even be a misleading indicator and, therefore, bio-impedance analysis is more accurate and reliable measure of obesity which gives total, visceral and segmental body composition. In the last few years, it has gained popularity and is being commonly used in clinical practice for exercise and rehabilitation programmes.10
To the best of authors’ knowledge, the relationship of total, segmental and visceral body composition indices with CTS clinical and neurophysiological markers has not been reported earlier. There have been no previous studies evaluating the effect of visceral fat on the electrodiagnostic severity of CTS.
Therefore, the present study was conducted to explore the relationships of segmental and total body composition adiposity indices with the electrophysiological severity of CTS in a sample of the Saudi population.
METHODOLOGY
The present research study was conducted at the Departments of Internal Medicine and Clinical Physiology at King Saud University Medical City, Riyadh, Saudi Arabia. The project was approved by Ethical Committee of Institutional Review Board, King Saud University Medical City. All patients signed an informed consent. Consecutive patients with CTS, attending the neurophysiology clinic between February 2018 and February 2019, were recruited. Based on literature search for 80% predictive power at 95% confidence interval, a sample size of about 60 subjects was calculated. The patients aged 18 years or older, presenting with a clinical diagnosis of CTS based on numbness / tingling involving thumb, index, and middle fingers, triggered by manual activities and relieved by shaking the hand out, and hand numbness / tingling that awoke the patient from sleep at least once in the last 2 weeks were included. Patients with severe length-dependent diabetic, hereditary polyneuropathy, or patient with weakness in muscles supplied by the ulnar nerve, radial nerve, or median nerve proximal to the wrist were excluded.
NCS were performed using a Nicolet Viking machine version 11.1 (VIASYS Healthcare Inc., USA). The NCS protocol for the assessment of CTS has been described in detail by this group.11 The staff performing each test were blinded from the results of the other tests. The severity of median neuropathy at the wrist was classified into 6 categories, using a previously published scale.11 NCS grade 0 denoted normal study; grade 1 (minimal) denoted the relative slowing of the median nerve observed by comparison, grade 2 (mild) is when the sensory NCS showed slowing of median conduction velocity; grade 3 (moderate) denoted prolonged median distal motor latency, grade 4 (severe) denoted decreased median compound muscle action potential amplitude; and grade 5 (extreme) denoted absent motor and sensory responses.
TANITA BC 418 MA, 8-electrode bio-impedance body composition analyser (BIA) was used, in which, low-ampere current is transferred from the tips of the toes of both feet and the fingertips of both hands and the voltage is measured. This method allows five segments differential impedance measurements that encompass whole body, right leg, left leg, right arm, and left arm compartments. The new 8-electrode system is extremely reliable and offers an important new opportunity of evaluating adiposity and fat-free mass, not only in clinical but research settings also. A high degree of correlation has been found to exist. The figures for body fat percentage, fat mass, and fat-free mass are highly correlated with gold standards like DEXA for individual parts and for the entire body and the results obtained are highly reproducible.12
Body composition analysis was performed in all participants immediately after finishing NCS. Body composition estimates, including total body fat % [TBF%], total fat mass [TFM], arm fat % [AF%], arm fat mass [AFM], visceral fat rating [VFR] scores, fat-free mass (FFM), truncal fat percentage (TRF%), truncal fat mass, total body water, and basal metabolic rate were obtained. Additionally, visceral fat was calculated by using specific ratings (≤12 indicates a normal standard level and >12 indicates a high score). The subjects were asked to take off their shoes, and stand over the electrodes of the device. BMI and body surface area were recorded. The body surface area was calculated using the Mosteller formula (SQR [body weight (kg) x height (cm) / 3600]).13,14 All the measures for standardised measurements of body composition were followed.
The analysis was carried out by hands. The body composition analyser gives segmental distribution of body composition separately for both upper limbs, both lower limbs and trunk. Therefore, it is worthwhile to study each limb separately. Since the composition of two upper limbs is different, therefore, the two hands of one patient were considered as independent observations.15,16
BMI, total body adiposity, visceral fat rating, and segmental adiposity in the upper limbs were selected as adiposity indices of interest to be included in the statistical analysis. Patients with CTS were divided into two groups based on NCS results; the first group was CTS-normal NCS (NCS grade 0), and CTS-abnormal NCS (NCS grade 1–5). Body composition indices were compared between the two groups.
Table I: Descriptive characteristics and body composition analysis of the study population.
|
Patients (N=61) |
Mean ± SD |
Minimum-Maximum |
|
Gender M/F |
11/50 |
|
|
Age (years) |
48.97 ±11.46 |
21-80 |
|
Height (cm) |
157.07 ±7.55 |
146-180 |
|
Weight (kg) |
79.53 ±17.74 |
47.8-128.6 |
|
BMI |
32.17 ±6.47 |
20.9-49.5 |
|
Basal metabolic rate (BMR) |
6121.25 ±1147.33 |
4322-10263 |
|
Total body fat % (TBF%) |
39.29 ±7.87 |
21.5-52.7 |
|
Total body Fat Mass (TFM) (kg) |
32.21 ±11.52 |
13.1-61.3 |
|
Total body fat free mass (kg) |
47.37 ±9.17 |
33.6-79.2 |
|
Total body water (TBW) |
34.74 ±6.66 |
24.6-58.0 |
|
Visceral fat rating (VFR) |
10.93 ±4.68 |
1-20 |
|
Arm fat % (AF%) |
21.90 ±21.09 |
0.6 – 62.2 |
|
Arm fat mass (AFM) |
2.24 ±0.84 |
0.6-4.8 |
|
Arm fat free mass (AFFM) |
2.44 ±0.64 |
1.5-4.8 |
|
Trunk fat % (TF%) |
36.45 ±7.90 |
19.2-50.7 |
|
Trunk fat mass (kg) (TFM) |
15.90 ±5.67 |
5.4-27.0 |
|
Trunk fat free mass (kg) (TFFM) |
26.31 ±4.51 |
19.7-40.8 |
|
Values are expressed as Mean ± SD. Note: AF%, AFM and AFFM have been calculated for 122 arms since right and left arms were calculated separately. |
||
|
Model |
NCS severity score as dependent variable |
Median distal latency as dependent variable |
||
|
Variables
|
Standardised coefficients beta (95%CI) |
p-values
|
Standardised coefficients beta (95%CI) |
p-values
|
|
BMI |
-0.216 (-0.157 - 0.062) |
0.394 |
-0.251 (-0.165 - 0.061) |
0.365 |
|
TFM |
0.247 (-0.045 - 0.106) |
0.423 |
0.201 (-0.055 - 0.101) |
0.553 |
|
VFR |
0.613 (0.116- 0.256) |
<0.001 |
0.317 (0.017 - 0.169) |
0.017 |
|
AFM |
-0.100 (-1.139 - 0.841) |
0.766 |
0.166 (-0.772 - 1.233) |
0.650 |
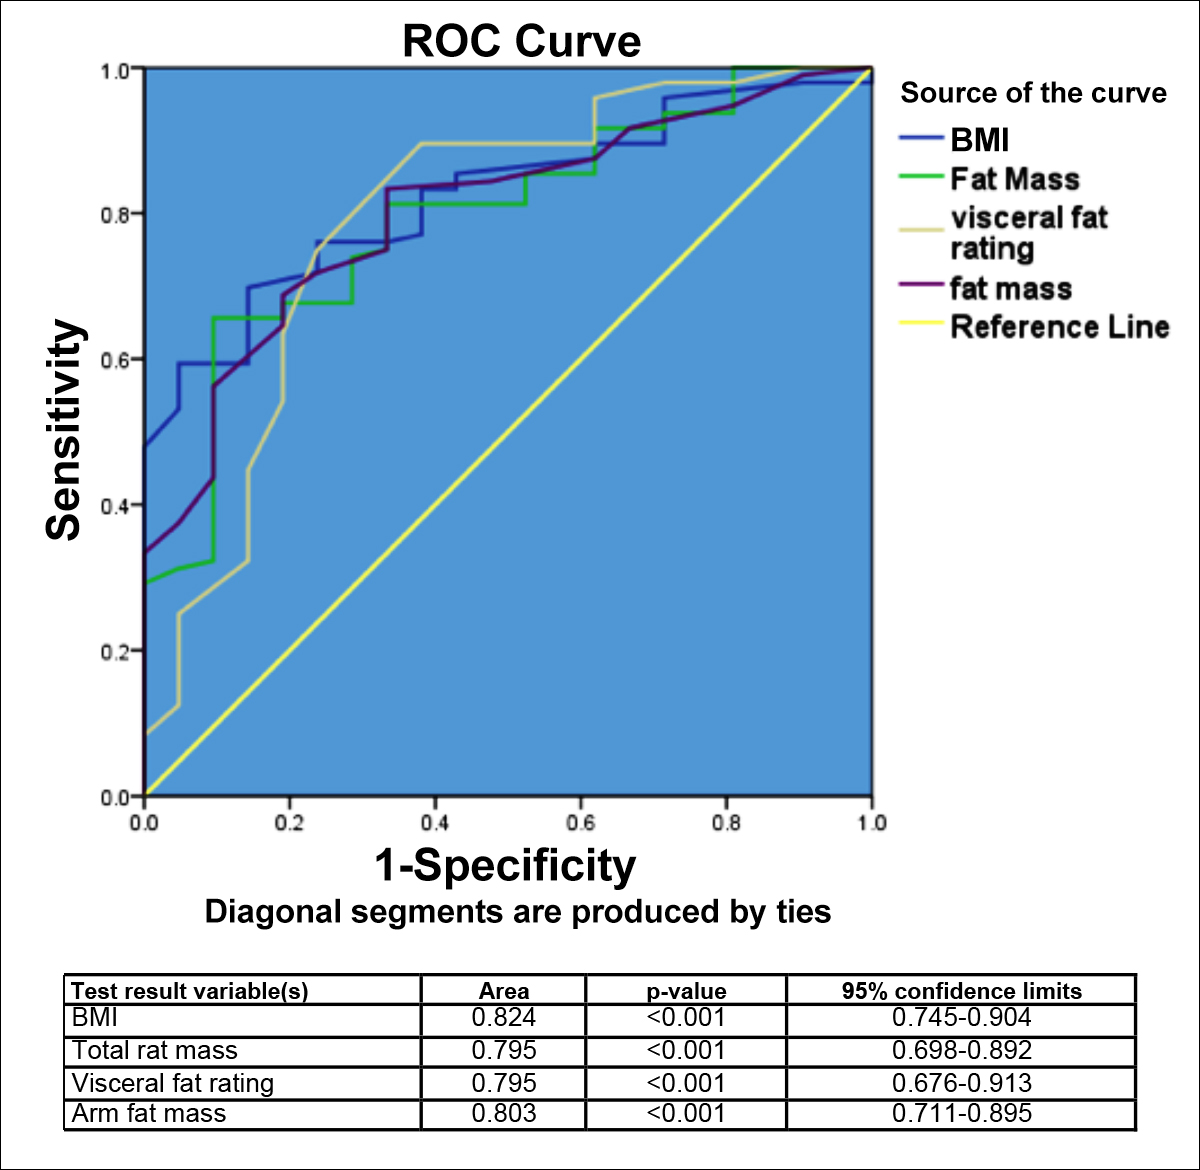 Figure 1: ROC analysis comparing the predicative value of BMI, TFM, VFR and AFM with AUC for electrodiagnostically confirmed CTS i.e., NCS grade 1 – 5 vs normal NCS (grade 0).
Data were entered and analysed by SPSS for Windows version 20.0 (SPSS Inc., Chicago, IL). Quantitative data were expressed as mean ± S.D, while qualitative as frequencies and percentages. Spearman’s correlation coefficients, ROC analysis, and regression models were applied to explore the relationship between different variables and adiposity indices, and to determine their predictive value. A p-value of <0.05 was taken as statistically significant.
RESULTS
There were 61 CTS patients with a mean age of 48.97 ±11.46 years. The study population included 11 male patients (18%) and 50 females (82%). A total of 109 hands with clinical CTS were studied; and in 9 hands there were no complaints. Table I expresses the descriptive characteristics of the study population, and body composition indices.
Body composition indices (i.e., BMI, TFM, TBF%, AFM, AF% and VFR) were evaluated as markers of interest for this study. The mean values for BMI, TBF%, TFM, VFR, AF%, and AFM were 32.17 ±6.47, 39.29 ±7.87, 32.21 ±11.52, 10.93 ±4.68, 21.90 ±21.09, and 2.24 ±0.84, respectively (Table I). The NCS severity score had significantly correlation with BMI (r=0.343, p<0.001), TFM (r=0.421, p<0.001), AFM (r=0.374, p<0.001), TBF% (r=0.363, p<0.001), AF% (r=0.299, p=0.001), and VFR (r=0.569, p<0.001). The electrophysiologically confirmed CTS correlated significantly with BMI (r=0.431, p<0.001), TFM (r=0.394, p<0.001), AFM (r=0.403, p<0.001), TBF% (r=0.371, p<0.001), AF% (r=0.392, p<0.001) and VFR (r=0.394, p<0.001). Median nerve motor distal latency also correlated significantly with BMI (r=0.379, p<0.001), TFM (r=0.432, p<0.001), AFM (r=0.431, p<0.001), TBF% (r=0.442, p<0.001), AF% (r=0.416, p<0.001), and VFR (r=0.460, p<0.001).
Receiver operating curve (ROC) analysis comparing the predictive value of BMI, TFM, VFR, and AFM with the AUC for CTS severity determined by NCS as a dichotomous variable (CTS with normal NCS = grade 0, and CTS with abnormal NCS = grade 1 – 5). The presence of abnormal NCS was also significantly predicted by BMI, TFM, VFR, and AFM with AUC values of 0.824, 0.795, 0.795, and 0.803, respectively (Figure 1). However, the AUC for VFR, BMI, AFM, and TFM did not differ significantly between each other.
Linear regression models were created adjusting for age and gender with NCS severity and median distal latency as dependent variables and adiposity indices as independent variables to compare the predictive value of adiposity indices (Table II). VFR significantly predicted NCS severity (β=0.613, p<0.001) and delayed median distal latency (β = 0.317, p=0.017). After adjusting for age and gender with NCS severity score as dependent variable, VFR was still significant (β=0.514, p=0.002); while after adjustment for covariates like gender and age the VFR became non-significant (β=0.170, p=0.328) using the median distal latency as dependent variable.
DISCUSSION
This is the first study to report the relationship of total, segmental and visceral body composition indices with CTS clinical and neurophysiological markers. The key results of the present study show significant correlations between the electrodiagnostic severity of CTS and BMI, VFR, TFM, TBF%, AFM, and AF%. However, after controlling for age and gender, VFR was the only factor found to be independently associated with the electrodiagnostic severity of CTS in patients who met the clinical definition of CTS. To the best of authors’ knowledge, there have been no previous studies evaluating the effect of visceral fat on the electrodiagnostic severity of CTS.
In this study, the analysis was carried out by hands. Since the body composition analyser gives segmental distribution of body composition separately for both upper limbs, both lower limbs and trunk. Therefore, it is worthwhile to study each limb separately. Since the composition of two upper limbs is different, therefore, the two hands of one patient were considered as independent observations.
It has been reported that having high BMI contributes as an independent risk factor for developing CTS in patients under 63 years; while in older ages, it becomes less important.17 A recent study by Trybus et al. reported that there were many significant differentiating features in anatomical features of the upper limbs between normal healthy individuals compared to CTS patients.18
The association between high BMI and CTS has been confirmed by various studies that were recently grouped in a meta-analysis,19 according to which, obesity results in a 2-fold increase in the risk of CTS, and a dose-response relationship was observed whereby a one-unit increase in BMI increases the risk of CTS by 7.4%.1 Moreover, the reported effect of BMI is not influenced by gender or other confounding factors.19 This association supports the findings of our study as waist circumference can be considered as a crude indicator of visceral fat.
The mechanism by which BMI is linked to CTS remained to be elucidated. Several authors have proposed that deposition of excess adipose tissue within the carpal tunnel causes high canal pressure, leading to ischemia; high canal pressure may also cause thickening and fibrosis of the tenosynovium, leading to focal demyelination and, subsequently, to axonal loss.19,20 Conversely, Werner et al. found no association between obesity indices and carpal tunnel canal pressure and the median nerve cross sectional area.21 Another study also did not find correlations between BMI and the degree fibrosis within the tenosynovium or severity of edema.22
Metabolic changes that are associated with increased visceral fat with dysregulation of lipid and glucose metabolism can lead to nerve damage through the ensuing mitochondrial dysfunction and, ultimately, oxidative stress. Nerve injury can occur, in the setting of metabolic syndrome, as a result of fatty acids deposition in the nerves and increased protein and fatty acids glycation and oxidation.23 In addition, median neuropathy by the aforementioned mechanisms, even if subclinical, can increase its susceptibility to compression within the carpal tunnel.20 The results of present study demonstrate that fat content of arms and visceral adiposity affects the CTS severity and NCS parameters significantly. These can be important preventable factors in a selected group of CTS cases. Therefore, body composition analysis might be a useful clinical assessment tool to evaluate the CTS patients.
It is acknowledged that the techniques for measuring body composition in vivo can lead to two types of errors, one is the methodological error during data collection, and the second error may arise from the assumptions used to convert raw data into final values.24,25 Further, a possible confounding effect of certain conditions, such as diabetes and hypothyroidism, that have associations with obesity and CTS, was not controlled for in this study. Moreover, the association between visceral fat and the electrodiagnostic severity of CTS does not imply causation, and this finding merits replication and confirmation in a large-scale study.
CONCLUSION
Body composition adiposity indices including total and segmental indicators are significantly related with clinical severity of CTS and electrophysiological parameters, especially visceral adiposity. Future studies at large scale with prospective designs are required to explore the true predictive value of body composition in CTS cases.
DISCLOSURE:
This study was supported by a grant from Deanship of Scientific Research (Grant Number: RGP-1438-048), King Saud University, Riyadh, Saudi Arabia.
ETHICAL APPROVAL:
The present study was approved by Institutional Review Board of King Saud University Medical city, King Saud University, Riyadh under the project No: E-15-1581.
PATIENTS’ CONSENT:
Informed consents were obtained from all the patients for performing all the tests and to publish the obtained data.
CONFLICT OF INTEREST:
There are no conflicts of interest related to the present study.
AUTHORS' CONTRIBUTION:
SSH: Conception of the research idea, study design, body composition analysis, data collection, statistical analysis, literature review and writing the manuscript.
MHA: Conception of the research idea, study design, recruitment of patients, nerve conduction studies, data collection, literature review and writing the manuscript.
REFERENCES
- Kozak A, Schedlbauer G, Wirth T, Euler U, Westermann C, Nienhaus A. Association between work-related biomechanical risk factors and the occurrence of carpal tunnel syndrome: An overview of systematic reviews and a meta-analysis of current research. BMC Musculoskelet Disord 2015; 16:231. doi: 10.1186/s12891-015-0685-0.
- Unno F, Lucchina S, Bosson D, Fusetti C. Immediate and durable clinical improvement in the non-operated hand after contralateral surgery for patients with bilateral Carpal Tunnel Syndrome. Hand (NY) 2015; 10(3):381-7. doi: 10.1007/s11552-014-9719-6.
- Mondelli M, Curti S, Mattioli S, Aretini A, Ginanneschi F, Greco G, et al. associations between body anthropometric measures and severity of carpal tunnel syndrome. Arch Phys Med Rehabil 2016; 97(9):1456-64. doi: 10.1016/j.apmr.2016.03.028.
- Vögelin E, Mészàros T, Schöni F, Constantinescu MA. Sonographic wrist measurements and detection of anatomical features in carpal tunnel syndrome. Scientific World J 2014; 2014:657906. doi: 10.1155/2014/657906.
- Papanicolaou GD, McCabe SJ, Firrell J. The prevalence and characteristics of nerve compression symptoms in the generalpopulation. J Hand Surg Am 2001; 26(3):460-6. doi: 10.1053/jhsu.2001.24972.
- Moghtaderi A, Izadi S, Sharafadinzadeh N. An evaluation of gender, body mass index, wrist circumference and wrist ratio as independent risk factors for carpal tunnel syndrome. Acta Neurol Scand 2005; 112(6):375-9. doi: 10.1111/ j.1600-0404.2005.00528.x.
- Barr KP. Electrodiagnosis in the patient with metabolic syndrome: Adding value to patient care. Phys Med Rehabil Clin N Am 2018; 29(4):735-49. doi: 10.1016/j.pmr.2018.06.008.
- Hui ACF, Wong S, Griffith J. Carpal Tunnel Syndrome. Prac Neurol 2005; 5:210-7.
- Urbaniak JR, Desai SS. Complications of nonoperative and operative treatment of carpal tunnel syndrome. Hand Clin 1996; 12:325-35.
- Habib SS. Body mass index and body fat percentage in assessment of obesity prevalence in saudi adults. Biomed Environ Sci 2013; 26(2):94-9. doi: 10.3967/0895- 3988.2013.02.003.
- Alanazy MH. Clinical and electrophysiological evaluation of carpal tunnel syndrome: approach and pitfalls. Neurosciences (Riyadh) 2017; 22(3):169-80. doi: 10.17712/nsj.2017.3.20160638.
- Guedes DP, Calabrese JC, Pirolli PM. Use of different segmental multi-frequency bioelectrical impedance devices for analysis of body composition in young adults: Comparison with bioelectrical spectroscopy. Nutr Hosp 2019; 36(3):618-25. doi: 10.20960/nh.2376.
- Iqbal M, Al-Regaiey KA, Ahmad S, Al Dokhi L, Al Naami M, Habib SS. Body composition analysis to determine gender specific physical fitness equations in a cohort of Saudi population. Pak J Med Sci 2014; 30(4):798-903. doi: 10.12669/pjms.304.4974.
- Piccirilli M, Doretto G, Adjeroh D. A framework for analyzing the whole body surface area from a single view. PLoS One 2017; 12(1):e0166749. doi: 10.1371/journal.pone.0166749.
- Moore ML, Benavides ML, Dellinger JR, Adamson BT, Tinsley GM. Segmental body composition evaluation by bioelectrical impedance analysis and dual-energy X-ray absorptiometry: Quantifying agreement between methods. Clin Nutr 2019; S0261-5614(19)33178-4.
- Wingo BC, Barry VG, Ellis AC, Gower BA. Comparison of segmental body composition estimated by bioelectrical impedance analysis and dual-energy X-ray absorptiometry. Clin Nutr ESPEN 2018; 28:141-7. doi: 10.1016/j.clnesp.2018.08.013.
- Bland JD. The relationship of obesity, age, and carpal tunnel syndrome: more complex than was thought? Muscle Nerve 2005; 32(4):527-32. doi: 10.1002/mus.20408.
- Trybus M, Stepańczak B, Koziej M, Gniadek M, Kołodziej M, Hołda MK. Hand anthropometry in patients with carpal tunnel syndrome: A case-control study with a matched control group of healthy volunteers. Folia Morphol (Warsz) 2019; 78(1):182-90. doi: 10.5603/FM.a2018.0049.
- Shiri R, Pourmemari MH, Falah-Hassani K, Viikari-Juntura E. The effect of excess body mass on the risk of carpal tunnel syndrome: A meta-analysis of 58 studies. Obes Rev 2015; 16(12):1094-104. doi: 10.1111/obr.12324.
- Sonoo M, Menkes DL, Bland JDP, Burke D. Nerve conduction studies and EMG in carpal tunnel syndrome: Do they add value? Clin Neurophysiol Pract 2018; 3:78-88. doi: 10.1016/j.cnp.2018.02.005.
- Werner RA, Jacobson JA, Jamadar DA. Influence of body mass index on median nerve function, carpal canal pressure, and cross-sectional area of the median nerve. Muscle Nerve 2004; 30(4):481-5. doi: 10.1002/mus.20125.
- Scott KL, Conley CR, Renfree KJ. Histopathologic evaluation of flexor tenosynovium in recurrent carpal tunnel syndrome. Plast Reconstr Surg 2019; 143(1):169-75. doi: 10.1097/PRS.0000000000005090.
- Callaghan B, Feldman E. The metabolic syndrome and neuropathy: Therapeutic challenges and opportunities. Ann Neurol 2013; 74(3):397-403. doi: 10.1002/ana.23986.
- Habib SS, Bashir S, Iqbal M, Abdelaziz GM, Alyahya R, Alzahrani GK, et al. Cardiovascular risk and neurocognitive assessment in young adults and their relationship to body adiposity. Med Sci Monit 2018; 24:7929-35. doi: 10.12659/MSM.909914.
- Wells JCK, Fewtrell MS. Measuring body composition. Arch Dis Child 2006; 91(7):612-7. doi: 10.1136/adc.2005.085522.