Evaluation of the Association between Lumbar Spinal Stenosis and Lumbar Subcutaneous Fat Tissue Thickness by MRI: A Novel Perspective
By Basak Atalay1, Fatih Saritepe2, Arda Topcam2, Hasan Guclu3, Mehmet Sabri Gurbuz2Affiliations
doi: 10.29271/jcpsp.2022.02.147ABSTRACT
Objective: To evaluate whether lumbar subcutaneous fat tissue thickness (LSFTT) on midsagittal magnetic resonance imaging (MRI) is associated with lumbar spinal stenosis (LSS).
Study Design: Observational cross-sectional study.
Place and Duration of Study: Department of Radiology and Neurosurgery, Istanbul Medeniyet University School of Medicine, Istanbul, Turkey between January 2018 and December 2020.
Methodology: The study group included 79 patients, who had undergone surgery for lumbar spinal stenosis. The control group included MRI scans of 80 individuals without lumbar spinal stenosis. Association between LSFTT and LSS was analysed through a comparison of both the groups.
Results: The agreement between the two observers was found to be very good agreement with a two-way mixed intra-class correlation coefficient of 0.986 or higher (p <0.001). There was statistically significant differences between the LSS and non-LSS groups for both L5-S1 and L4-5 level measurements, p=0.001, and p=0.004, respectively. L5-S1 level measurements in the LSS group showed 29% increase in average with respect to the non-LSS group; and in L4-L5 level measurements, the increase was 40% in median. Females exhibited significantly higher values in both levels, (p <0.001 and p <0.001, respectively).
Conclusions: Lumbar subcutaneous fat tissue thickness is significantly associated with lumbar spinal stenosis. Measuring LSFTT on mid-sagittal MRI is an easily applicable, reproducible alternative method for predicting LSS.
Key Word: Lumbar, Spinal canal, Stenosis, Subcutaneous fat tissue, Magnetic resonance imaging.
INTRODUCTION
Obesity is a pandemic with severe medical and financial implications. It has increased dramatically in recent years. Many studies have assessed its association with degenerative spinal diseases. Increasing life expectancy, widespread use of magnetic resonance imaging (MRI) scan, and lifestyle changes have eventually resulted in a concomitant increase in the rates of overweight and LSS worldwide.1,2
Various studies have been published regarding the association between degenerative spinal diseases and the parameters, such as the body mass index (BMI), para-spinal fat content, and epidural lipomatosis.1,3-8
Since the vertebral column together with its muscles and ligaments is the load-bearing structure of the body, any increase in the load will probably affect its fate. BMI is a relatively simple measurement but still requires the patient’s weight and height values to be calculated, which might add limitations to a retrospective study.
It was postulated that a simple measurement on an MRI scan (lumbar subcutaneous fat tissue thickness) which takes only a few seconds to measure would help determine the association with lumbar spinal stenosis. These data, if proven so, might help spine surgeons determine the risk groups and make appropriate recommendations. To the best of authors’ knowledge, no previous study has evaluated the association between lumbar subcutaneous fat tissue thickness and lumbar spinal stenosis.
The aim of this study was to explore the association between lumbar subcutaneous fat tissue thickness on MRI and lumbar spinal stenosis in a Turkish population.
METHODOLOGY
Ethical approval was obtained from the University Ethics Committee (Decision number and date: 2021/0341) and the Committee waived of the need for informed consent due to the retrospective nature of the study.
This retrospective study involved two groups of patients. The first group (study group) included 79 patients, who had undergone surgery for lumbar spinal stenosis between 2018 and 2020 in the Neurosurgery and Radiology Departments of Medeniyet University School of Medicine, Istanbul, Turkey.
The second group (control group) included 80 individuals whose lumbar MRI scans were taken due to the complaint of low back pain within 2018. The patients in the second group did not have lumbar spinal stenosis, but were older than 40 years old, the age when spine begins to degenerate at a significantly faster rate.9
Inclusion criteria were patients whose MRIs were performed at our hospital and the quality of the scans was adequate for measurements. Exclusion criteria: patients who were operated at this institution, but imaging was done at another centre, inadequate lumbar spinal images for measurement; and participants under 40 years of age were excluded from the study. Lumbar MRI scans were retrospectively retrieved from the picture archiving and communication system (PACS) of the hospital along with their demographic data such as age and gender. Lumbar spinal MR images of the study and control groups were transferred to a computer. Two independent observers, blinded to the data, measured the LSFTT of the study and control groups at different times and recorded the data in an Excel file.
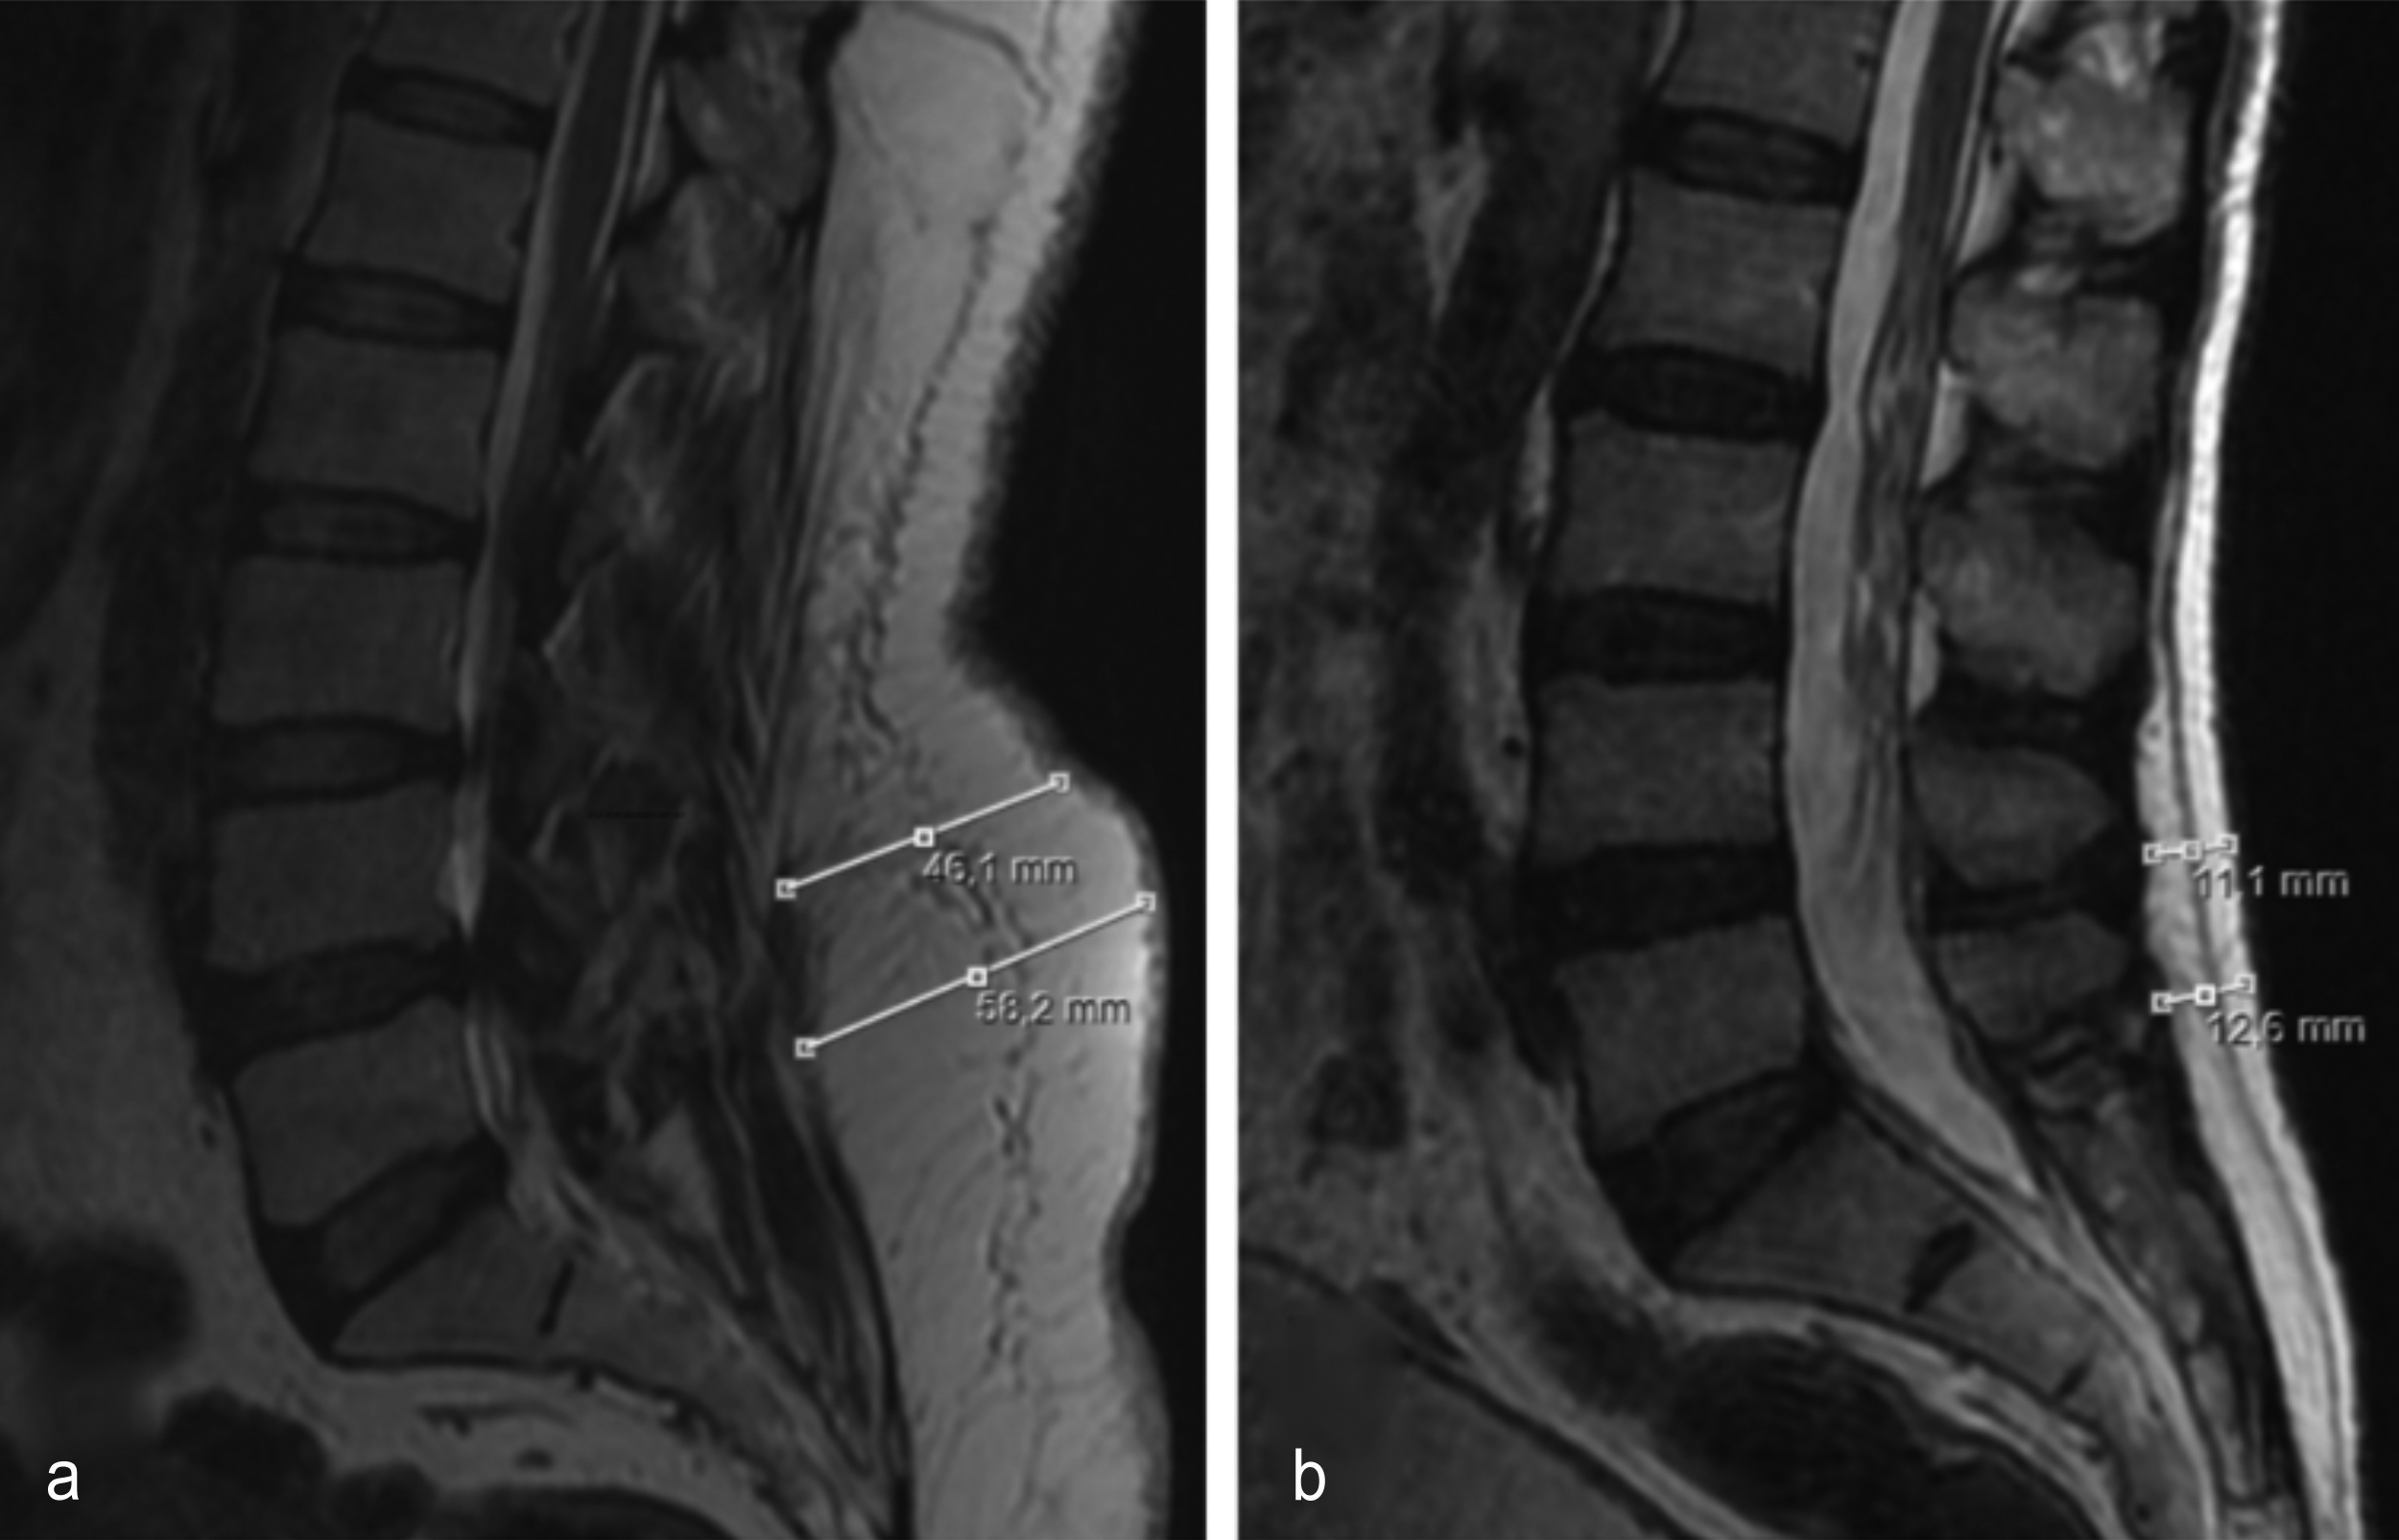 Figure 1: (a) Mid-sagittal T2-weighted magnetic resonance image shows the measurement of lumbar subcutaneous fat tissue thickness in a patient with lumbar spinal stenosis. (b) Mid-sagittal T2-weighted magnetic resonance image shows the measurement of lumbar subcutaneous fat tissue thickness in a patient without lumbar spinal stenosis.
Lumbar subcutaneous fat tissue thickness (LSFTT, mm) was defined as the thickness of the fat tissue between the subcutaneous fascia and thoracolumbar fascia. All measurements were performed using the length functions of the MR imaging console of the same magnet at this institution. Axial loading tends to affect mostly the lower levels of the spine. Similarly, fat tends to accumulate around the waist, which is almost at the same level as the lower level of the spine, namely L4-5 and L5-S1 levels. For these reasons, LSFTT was calculated from the measurements on the mid-sagittal T2-weighted lumbar MR images at both L4-5 and L5-S1 levels. Measurement lines were established to be perpendicular to the curvature (lordosis) of the lumbar spine (Figure 1). The measurements were done by two observers (Observer 1: a neurosurgeon; Observer 2: a radiologist) independently and blinded to the data.
SPSS Version 28 for Windows (IBM Corp.) was used to perform statistical analyses in this study. Two-way mixed intraclass correlation coefficient (ICC) measured the agreement between the measurements by two independent observers. Normality of continuous variables were checked by using Kolmogorov-Smirnov test. Normally distributed variables were described by their mean and standard deviations; whereas, non-normal variables are by their median and inter-quartile range (IQR). Continuous variables with normal distributions of two groups are compared by Student t-test; and non-normally distributed variables are compared by using Mann-Whitney U-test. Categorical variables are compared by Chi-square test. The results with significance p <0.05 have been considered statistically significant.
RESULTS
The agreement between the two observers showed the two-way mixed intraclass correlation coefficient to be higher than 0.986 (p<0.001 for all measurements) for LSS and non-LSS, for females and males, and for individuals aged less than 60 or 60 and over. This high level of agreement between the measurements encouraged the authors to use the average of these two measurements for the rest of the analyses.
The median age (IQR) in the LSS group (n=79) is 62.0 (15) and 58.5 (13) in the non-LSS group (n=80) and no significant difference has been observed (p=0.340). In the LSS group, the average age of females 58.9±10.5 (n=53) and males 66.5±8.1 (n=26) exhibited a significant difference (p=0.002); whereas, females with median age (IQR) 57 (11) (n=49) and males with median (IQR) age 62 (15) (n=31) in the non-LSS group have no significant difference in terms of age (p=0.426). Also, the distribution of males and females in the LSS (53 females, 67.1%) and non LSS group (49 females, 61.3%) showed no statistically significant difference (p=0.443). These results are summarized in Table I.
Table I: Comparison of demographic variables.
|
Variable |
Group1 |
Group 2 |
p* |
|
Agem |
LSS 62.0 (15) n=79 |
Non LSS 58.5 (13) n=80 |
0.340m |
|
Age (LSS group) |
Females 58.9±10.5 n=53 |
Males 66.5±8.1 n=26 |
0.002t |
|
Agem (Non LSS group) |
Females 57.0 (11) n=49 |
Males 62.0 (15) n=31 |
0.426m |
|
Sexx
|
LSS 67.1% n=26 |
Non LSS 61.3% n=31 |
0.443x |
|
tStudent t test; mean ± SD, mMann-Whitney U-test; median (IQR), xChi-square test; percentage, *Bold p values represent statistical significance. |
|||
|
Groups |
L4-6 |
L5-S1 |
|||||
|
1 |
2 |
Group 1 |
Group 2 |
p* |
Group 1 |
Group 2 |
p* |
|
LSS |
Non LSS |
28.9 (21.8) n=79 |
20.6 (17.2) n=80 |
0.004m |
33.8±13.0 n=79 |
26.2±14.3 n=80 |
<0.001t |
|
Males |
Females |
19.0 (14.4) n=57 |
28.6 (24.5) n=102 |
<0.001m |
23.1±11.8 n=57 |
33.9±13.9 n=102 |
<0.001t |
|
LSS Males |
LSS Females |
23.9±11.8 n=26 |
31.0±14.6 n=53 |
0.035t |
29.4±11.4 n=26 |
35.9±13.3 n=53 |
0.036t |
|
Non LSS Males |
Non LSS Females |
12.8 (12.7) n=31 |
22.9 (24.2) n=49 |
<0.001m |
17.7±9.4 n=31 |
31.6±14.3 n=49 |
<0.001t |
|
Age <60 LSS |
Age <60 Non LSS |
31.1 (16.9) n=36 |
21.2 (28.4) n=41 |
0.009m |
38.7±13.0 n=36 |
28.3±15.2 n=41 |
0.007t |
|
Age ≥60 LSS |
Age ≥60 Non LSS |
22.3 (18.3) n=43 |
20.2 (12.6) n=39 |
0.141m |
29.7±11.6 n=43 |
24.1±13.0 n=39 |
0.042t |
|
tStudent t test; mean ± SD, mMann-Whitney U-test; median (IQR). *Bold p-values represent statistical significance. |
|||||||
There was a statistically significant difference between the LSS and non-LSS group for both L5-S1 and L4-5 level measurements, p<0.001 and p=0.004, respectively as can be seen in Table II. L5-S1 level measurements in LSS group showed 29% increase in average with respect to non-LSS group and in L4-5 level measurements the increase was 40% in median. When the authors analysed both groups together based on gender, females exhibited significantly higher measurements in both L4-5 and L5-S1 levels, p <0.001 and p <0.001, respectively. The effect of gender separately in both LSS and non-LSS groups were similar: In the LSS group the females had 29% higher measurements in average for L4-5 (p=0.035) and for the L5-S1 they had 22% higher measurements in average (p=0.036). In the non-LSS group the females had 72% higher measurements for L4-5 (p<0.001) and for the L5-S1 they had 79% higher measurements (p<0.001).
Relatively younger individuals (younger than 60) in the LSS group exhibit significantly higher measurements than those in the non-LSS group for both L4-5 and L5-S1, 47% higher in median (p=0.009) and 37% higher in average (p=0.007), respectively. Relatively older individuals (60 or older) have shown a different behaviour: In the L4-5 measurement there was no significant difference between LSS and non LSS groups (p=0.141) whereas for the L5-S1 measurement the LSS group was 23% significantly higher than the non-LSS group (p=0.042).
DISCUSSION
In this study, there was a statistically significant difference between the LSS and non-LSS group for both L4-5 and L5-S1 level measurements. Lumbar subcutaneous fat tissue thickness at both L4-5 and L5-S1 levels are higher in the study group. Besides, the presence of LSS in females was seen at earlier ages. The adiposity duration and the hormonal differences between genders may also influence this situation. Based on the results of this study, the authors propose the use of this simple measure that may predict LSS.
Recently, researchers have emphasised the link between high BMI and spinal degenerative diseases, which are mainly caused by unequal load distribution to the spine along with aging process.3 With this regard, LSFTT may represent an increasing load to the lower levels of the lumbar spine. As shown in this study, L5-S1 and L4-5 measurements of the LSS patients were 29% and 26% higher than non LSS patients. In other words, a significant association has been found between LSFTT and lumbar spinal degeneration.
The most common presentation of degenerative spinal disorders is low back pain, which is a widespread public health concern and found related to overweight and disc degeneration.4,6,10 Liuke et al. found that a BMI ≥25 Kg/m2 was associated with a higher risk of lumbar disc degeneration, particularly in the younger patients.11 Azimi et al. studied the association between the BMI and surgical success of lumbar spinal stenosis and found that patients with a BMI value of ≤29.1 kg/m2 had experienced significantly higher surgical success.12 Knutsson et al. studied the association between BMI and LSS and found that obese and overweight patients were at higher risk of developing LSS.1 In a prospective multicenter observational study, Giannadakis et al. reported their 1-year follow-up results of LSS surgery and emphasised that although both non-obese and obese patients benefit from LSS surgery, improvement is less in obese patients.13 Length of the surgery was shorter in non-obese patients and they experienced greater improvement in both back and leg pain. It is not currently known as to how LSFTT affect the success of LSS surgery. However, this parameter is to be studied in the future and if proved so, it might be an indicator of surgical success.
Parkkola et al. studied healthy individuals regarding their disc and paraspinal muscle degeneration on MRI scans.14 They stated that muscle degeneration was in line with fat deposition in the musculature; and reported a significant association between disc and muscle degeneration. Teichtahl et al. have found an association between disc degeneration and high fat content of the paraspinal muscles.15 Faur et al. analysed the patients with chronic low back pain and found that the percentage of fatty atrophy of the multifidus muscle was higher at lower levels of the spine (L5-S1), which bear most of the spinal load.5 They found significant association between the degree of fatty atrophy of the multifidus muscle and the grade of lumbar disc degeneration. Additionally, the fatty atrophy scores of women were found higher, which is parallel to the results of this study. The female gender is associated with thicker LSFTT in both the study and control groups. In this study, lower level of the spine (L5-S1) was the level that significant association between LSS and LSFTT was confirmed in both males and females in two determined age groups with lumbar spinal stenosis.
LSS is the most frequent indication for spinal surgery in the older population and its association with obesity, which has become a great public health concern, particularly in developed countries.16 For this reason, the authors must find a simple way of estimating the risk for developing LSS to forewarn patients at outpatient clinics to minimise the problem. Yang et al. measured ‘dorsal subcutaneous thickness’ and assessed its association with lumbar disc degeneration.4 They found no significant correlation between dorsal subcutaneous thickness and lumbar disc degeneration. However, they did not perform any comparison between so-called healthy individuals and the patients with degenerative spine. If they had analysed the association between dorsal subcutaneous thickness and lumbar spinal stenosis, which is a true degenerative spinal disease occurring within years, they would probably find a significant association. Distinctly, it was postulated that there may be relevance between LSS and LSFTT and observed a significant association between LSFTT and LSS. The mean LSFTT value at both L4-5 and L5-S1 levels in the LSS group was significantly higher than the control group. It is also important to measure the lumbar fat thickness at the lower levels. Because excess fat always tends to accumulate particularly at the L5-S1 level. This is most probably the reason why significant results were found. Considering how the age and gender affect this relationship, LSFTT at the L5-S1 level becomes more prominent in elderly patients, while LSS is detected at a relatively younger age in females. These results have also shown that the LSFTT becomes more prominent in the patients, individuals younger than 60 years. It may be extrapolated that the effect of age takes precedence over the effect of excess load in the patients older than 60 years.
Genu et al. measured ‘posterior fat thickness’ similar to the measurement of this study, but did not correlate this value specifically to lumbar spinal stenosis.17 They reported a strong correlation between the weights of the patients and the values of posterior fat thickness. However, they did not report any detail on this particular association. Currently one cannot recommend the use of LSFTT instead of BMI in spine studies focusing on the association of obesity and spinal stenosis. This issue might be clarified if comparative large sample size studies can be conducted in the future.
Many questions remain to be answered about the association between the obesity and spinal stenosis, and concomitant increase in their prevalence.2 No prospective studies have been conducted to evaluate the effect of preoperative weight loss on the success of the spinal surgery.
The retrospective study design is the first limitation of this study and the prospective studies need to be conducted as well. Second, the association of LSFTT with the BMI, family history, comorbidities and lifestyle factors including diet, smoking, and physical activity was not evaluated. Many studies regarding these issues will be completed soon and the present simple but novel association might help researchers on this topic.
CONCLUSION
Lumbar subcutaneous fat tissue thickness at L4-5 and L5-S1 levels are significantly associated with lumbar spinal stenosis. Patients with low back pain are frequently evaluated with lumbar spinal MRI. With this simple MRI measurement, patients who might be candidates for spinal stenosis can be educated and guided for particular lifestyle changes and conservative measures.
ETHICAL APPROVAL:
Ethical approval was obtained from the University Ethics Committee (Decision number and date: 2021/0341).
PATIENT’S CONSENT:
The Committee waived of the need for informed patient’s consent due to the retrospective nature of the study.
CONFLICT OF INTEREST:
The authors declared no conflict of interest.
AUTHORS’ CONTRIBUTION:
BA: Conception and design; acquistion, analysis and interpretation of data; drafting the article; revising it critically for important intellectual content the article.
FS: Acquistion, analysis and interpretation of data.
AT, HG, MSG: Acquistion, analysis and interpretation of data; drafting the article; revising it critically for important intellectual content.
All the authors gave final approval of the version to be published.
REFERENCES
- Knutsson B, Sandén B, Sjödén G, Järvholm B, Michaëlsson K. Body mass ındex and risk for clinical lumbar spinal stenosis: A cohort study. Spine (Phila Pa 1976) 2015; 40(18):1451-6. doi: 10.1097/BRS.0000000000001038.
- Delgado-López PD, Castilla-Díez JM. Impact of obesity in the pathophysiology of degenerative disk disease and in the morbidity and outcome of lumbar spine surgery. Neurocirugia (Astur) 2018; 29(2):93-102. doi: 10.1016/j.neucir.2017.06.002.
- Takatalo J, Karppinen J, Taimela S, Niinimäki J, Laitinen J, Sequeiros RB, et al. Association of abdominal obesity with lumbar disc degeneration-a magnetic resonance imaging study. PLoS One 2013; 8(2):e56244. doi: 10.1371/journal.pone.0056244.
- Yang L, Mu L, Huang K, Zhang T, Mei Z, Zeng W, et al. Abdominal adipose tissue thickness measured using magnetic resonance imaging is associated with lumbar disc degeneration in a Chinese patient population. Oncotarget 2016; 7(50):82055-062. doi: 10.18632/oncotarget.13255.
- Faur C, Patrascu JM, Haragus H, Anglitoiu B. Correlation between multifidus fatty atrophy and lumbar disc degeneration in low back pain. BMC Musculoskelet Disord 2019; 20(1):414. doi: 10.1186/s12891-019-2786-7.
- Samartzis D, Karppinen J, Chan D, Luk KD, Cheung KM. The association of lumbar intervertebral disc degeneration on magnetic resonance imaging with body mass index in overweight and obese adults: A population-based study. Arthritis Rheum 2012; 64(5):1488-96. doi: 10.1002/art.33462.
- Özcan-Ekşi EE, Ekşi MŞ, Akçal MA. Severe lumbar ıntervertebral disc degeneration ıs associated with modic changes and fatty ınfiltration in the paraspinal muscles at all lumbar levels, except for L1-L2: A Cross-sectional analysis of 50 symptomatic women and 50 age-matched symptomatic men. World Neurosurg 2019; 122:e1069-e1077. doi: 10.1016/j.wneu.2018.10.229.
- Mannil M, Burgstaller JM, Thanabalasingam A, Winklhofer S, Betz M, Held U, et al. Texture analysis of paraspinal musculature in MRI of the lumbar spine: Analysis of the lumbar stenosis outcome study (LSOS) data. Skeletal Radiol 2018; 47(7):947-954. doi: 10.1007/s00256-018-2919-3.
- Siemionow K, An H, Masuda K, Andersson G, Cs-Szabo G. The effects of age, sex, ethnicity, and spinal level on the rate of intervertebral disc degeneration: A review of 1712 intervertebral discs. Spine (Phila Pa 1976) 2011; 36(17):1333-9. doi: 10.1097/BRS.0b013e3181f2a177.
- Zhang TT, Liu Z, Liu YL, Zhao JJ, Liu DW, Tian QB. Obesity as a Risk factor for low back pain: A meta-analysis. Clin Spine Surg 2018; 31(1):22-27. doi: 10.1097/BSD.000000000 0000468.
- Liuke M, Solovieva S, Lamminen A, Luoma K, Leino-Arjas P, Luukkonen R, et al. Disc degeneration of the lumbar spine in relation to overweight. Int J Obes 2005; 29(8):903-908. doi: 10.1038/sj.ijo.0802974.
- Azimi P, Yazdanian T, Shahzadi S, Benzel EC, Azhari S, Nayeb Aghaei H, et al. Cut-off value for body mass ındex in predicting surgical success in patients with lumbar spinal canal stenosis. Asian Spine J 2018; 12(6):1085-1091. doi: 10.31616/asj.2018.12.6.1085.
- Giannadakis C, Nerland US, Solheim O, Jakola AS, Gulati M, Weber C, et al. Does obesity affect outcomes after decompressive surgery for lumbar spinal stenosis? A multicenter, observational, registry-based study. World Neurosurg 2015; 84(5):1227-34. doi: 10.1016/j.wneu.2015.06.020.
- Parkkola R, Kormano M. Lumbar disc and back muscle degeneration on MRI: Correlation to age and body mass. J Spinal Disord 1992; 5(1):86-92. doi: 10.1097/00002517- 199203000-00011.
- Teichtahl AJ, Urquhart DM, Wang Y, Wluka AE, O'Sullivan R, Jones G, et al. Lumbar disc degeneration is associated with modic change and high paraspinal fat content - a 3.0T magnetic resonance imaging study. BMC Musculoskelet Disord 2016; 17(1):439. doi: 10.1186/s12891-016-1297-z.
- Deyo RA, Mirza SK, Martin BI, Kreuter W, Goodman DC, Jarvik JG. Trends, major medical complications, and charges associated with surgery for lumbar spinal stenosis in older adults. JAMA 2010; 303(13):1259-65.doi: 10.1001/jama. 2010.338.
- Genu A, Koch G, Colin D, Aho S, Pearson E, Ben Salem D. Factors influencing the occurrence of a T2-STIR hypersignal in the lumbosacral adipose tissue. Diagn Interv Imaging 2014; 95(3):283-8. doi: 10.1016/j.diii.2013.10.005.