Expression and Clinical Significance of ANXA1 and DICER1 in Myelodysplastic Syndromes
By Wenqi Wu, Chengyao Wan, Qiongni Xie, Xiaolin Liang, Jing Wen, Zhenfang LiuAffiliations
doi: 10.29271/jcpsp.2020.12.1291ABSTRACT
Objective: To explore the expression status of ANXA1 and DICER1 and their clinical significance in myelodysplastic syndromes (MDS) patients.
Study Design: A case control study.
Place and Duration of Study: Department of Hematology, The First Affiliated Hospital of Guangxi Medical University, Nanning, Guangxi, China, from January 2011 to June 2020.
Methodology: Quantitative real-time fluorescence PCR (qRT-PCR) was carried out to detect ANXA1 and DICER1 expression levels in the bone marrow from 49 MDS patients and 12 healthy volunteers as control. The correlation of the clinical parameters and ANXA1 or DICER1 expression was then analysed in MDS.
Results: Compared with normal controls, the expression of bone marrow ANXA1 and DICER1 in MDS patients was significantly decreased, especially in patients with secondary acute myeloid leukemia (s-AML). Moreover, down-expression of ANXA1 had a great effect on differentiating s-AML subjects from MDS cases, and DICER1 expression showed good performance to screen MDS subjects from normal controls. ANXA1 expression was negatively correlated with clinical features of poor prognosis such as the percentage of bone marrow blasts, IPSS and WHO subtypes.
Conclusions: Bone marrow ANXA1 may be a potential biomarker for the risk prediction of leukemia transformation in MDS. DICER1 may have diagnostic significance to MDS.
Key Words: Myelodysplastic syndrome, Secondary acute myeloid leukemia, ANXA1, DICER1.
INTRODUCTION
Myelodysplastic syndromes (MDS), which originates from hematopoietic stem cell, is a clonal malignant disorder characterised by dysplastic hyperplasia in one or more cell lineages, ineffective hematopoiesis, refractory hemocytopenia and a variable inclination to develop into acute myeloid leukemia (AML). The incidence of MDS is approximately 4/100000 population/ year, but it is principally a disease of the elderly (over 70 years old) with an incidence of more than 0.03%/year.1 The clinical manifestations and prognosis of patients are considerably different. Correct and early diagnosis and treatment of MDS are often extremely difficult.
At present, individualised therapy is carried out according to the prognosis of MDS patients: the low-risk MDS patients can be treated with supportive care or immunomodulatory drugs such as lenalidomide and anti-thymocyte globulin, while patients with high-risk MDS are appropriate for demethylation drugs, combined chemotherapy or allogeneic hematopoietic stem cell transplantation (HSCT). However, the exact mechanism resulting in hematopoietic failure in MDS and AML patients is still unclear. In order to further understand the molecular biological mechanism of MDS, it is necessary to identify effective biomarkers to diagnose and estimate the prognosis of MDS patients and provide clues for predicting the risk of leukemia transformation.
MDS is a hematopoietic disease which is highly heterogeneous. Its molecular pathogenesis and the mechanism of transformation into AML have not been full elucidated, in which the abnormal expression of micro-ribonucleic acids (miRNAs) may play an important role. MiRNA is a group of endogenous non-coding RNA, with a length of 19-25 nucleotides. Over 1900 miRNAs have been reported that have critical regulatory functions and are involved in virtually all physiological processes by controlling gene encoding protein to regulate cell development, proliferation, differentiation, apoptosis and metabolism, homeostasis.2 Besides, miRNAs are aberrantly expressed in different malignancies, which regulate suppressors or oncogenes to facilitate cancer biologies such as tumor growth, invasion, angiogenesis, and immune evasion.3 Recently, it is reported that part miRNAs were global down expressed in bone marrow mesenchymal stromal cells (MSCs) of MDS, suggesting that the abnormal expression of miRNA may be involved in the pathogenesis of MDS.4
Authors’ preliminary work discovered that the expression of BM miR-196b in MDS patients increased significantly and rose with the disease risk. Bioinformatics techniques were used to predict potential target genes of miR-196b. We verified the reliability and validity of some genes by quantitative real-time fluorescence PCR (qRT-PCR) and found that human Annexin A1 (ANXA1) and DICER1 were differentially expressed in bone marrow from MDS patients.
However, the patterns of bone marrow ANXA1 and DICER1 expression and their clinical significance in MDS remain unknown. To address this problem, the aim of the current study was to explore the expression and clinical value of ANXA1 and DICER1 in MDS patients.
METHODOLOGY
The study was approved by the Human Ethics Committee of The First Affiliated Hospital of Guangxi Medical University. A total of 61 bone marrow samples were obtained from 38 MDS patients before any chemotherapy, 11 MDS patients who subsequently developed into secondary acute myeloid leukemia (s-AML) and 12 healthy volunteers from 2011 to 2014 in The First Affiliated Hospital of Guangxi Medical University. All MDS patients received regular follow-up and the follow-up period was up to June 2020 (84 months). The patients who had other hematological diseases or malignant tumors were excluded. Twelve healthy volunteers had no obvious abnormalities in all examination indexes. Written informed consents were obtained from all the participants according to the Declaration of Helsinki prior to bone marrow collection. MDS patients were classified according to the World Health Organization (WHO, 2016) Criteria. Refer to the International Prognostic Scoring System (IPSS), MDS patients were divided into three groups: relatively low-risk group (low risk + intermediate risk I, n=23), relatively high-risk group (intermediate risk II +high risk, n=15), and s-AML group (n=11). Detailed clinical features of 49 MDS patients were provided in Table I.
Up to 2ml BM sample was extracted from each participant and BM mononuclear cells was seperated by density gradient centrifugation. Total RNA was isolated from BM cells using TRIzol reagent (Invitgen, USA) according to the manufacturer’s instructions. RNA was then reverse transcribed to cDNA. Reverse transcription was performed with SuperScriptTM III Reverse Transcriptase (Invitrogen) on Gene Amp PCR System 9700 (Applied Biosystems). QRT-PCR was processed on ViiA 7 Real-time PCR System (Applied Biosystems) using 2X PCR master mix Kit (Arraystar). Conditions of qRT-PCR were as follows: 95°C for 10 min, followed by 40 PCR cycles (95°C for 10s) and 60°C for 1 min. The primers used in the present study were as follows: GAPDH forward: 5’GGGAAACTGTGGCGTGAT3’ and revers: 5’GAGTGGGTGTCGCTGTTGA3; ANXA1 forward: 5’ACCTTCAATCCATCCTC GG3’ and reverse: 5’TGATCTGTTGACG CTGTGC3; DICER1 forward: 5’TGCAATGTGAGACCGAATG3’ and reverse: 5’CATAGTTAGGACTGCGGAAAG3. The relative ANXA1 and DICER1 expression was calculated with the comparative 2−∆∆Ct method using housekeeping gene GAPDH as the endogenous normaliser.
As the data were not subjected to normal distribution, the relative ANXA1 and DICER1 expression among different groups was analysed using the Mann-Whitney U-test or Kruskal-Wallis test as appropriate. Quantitative variables were expressed as median (IQR). With the median expression of ANXA1 and DICER1 as the cut-off value, patients with MDS were divided into high expression group and low expression group. Qualitative variables were expressed as frequencies and percentages. Pearson Chi-square test or Fisher’s exact probabilities was employed to detect the relationship between the expression of ANXA1 or DICER1 and clinical characteristics. And r value was used to evaluate the degree of linear correlation between two variables. Receiver operating characteristic (ROC) curve and the area under the curve (AUC), sensitivity and specificity were used to assess the diagnosis value of bone marrow ANXA1 and DICER1 expression. Kaplan-Meier survival analysis was carried out to explore the relationship between the expression of ANXA1/DICER1 and patient clinical outcome. The statistical analyses were processed with SPSS 25.0 (SPSS Inc, Chicago, IL, USA) and GraphPad Prism 7 (GraphPad Software Inc., La Jolla, CA, USA) software. Results were considered statistically significant when p-value <0.05.
RESULTS
QRT-PCR results revealed that bone marrow ANXA1 expression in each subgroup of MDS was significantly lower than normal controls (p<0.05, Figure 1A). And s-AML patients had dramatically lower ANXA1 expression than patients with relatively low-risk MDS and patients with relatively high-risk MDS (p<0.05, Figure 1B). More importantly, ROC curve analysis showed that ANXA1 was a potential indicator for distinguishing s-AML patients from MDS patients with AUC of 0.799, and the sensitivity and specificity were 81.82% and 84.21%, respectively (p=0.003, Figure 2).
On the other hand, the expression of DICER1 from each MDS subgroup was obviously more reduced compared to normal controls, especially in the s-AML group (all p <0.01, Figure 1C-D). ROC curve analysis showed that compared to healthy controls, low-expression of DICER1 may have the diagnostic reference value for MDS as the AUC value was 0.821 and its sensitivity and specificity were 66.67% and 79.59%, respectively (p=0.001, Figure 3). The relative expressions of ANXA1 and DICER1 were shown in Table II.
The median values of absolute neutrophil counts (ANC), hemoglobin and platelets were used as the cut-off values to divide the MDS patients into high group and low group. As shown in Table I, ANXA1 expression was negatively correlated to the percentage of bone marrow (BM) blasts (r=-0.315, P=0.027, WHO classification (r=-0.259, p=0.009), IPSS (r=-0.365, p=0.011) in MDS patients.
Table I: Association between different clinical features and ANXA1 or DICER1 expression in MDS patients.|
Clinical variables |
ANXA1 Expression |
DICER1 Expression |
||||
|
Low(n=25) |
High(n=24) |
P |
Low(n=25) |
High(n=24) |
P |
|
|
Gender |
|
|
0.196 |
|
|
0.913 |
|
Male |
18(72%) |
13(54.2%) |
|
16(64%) |
15(62.5%) |
|
|
Female |
7(28%) |
11(45.8%) |
|
9(36%) |
9 (37.5%) |
|
|
BM blasts (%) |
|
|
0.027 |
|
|
0.296 |
|
<5 |
11(44%) |
18(75%) |
|
13(52%) |
16(66.7%) |
|
|
>5 |
14(56%) |
6(25%) |
|
12(48%) |
8(33.3%) |
|
|
PLT(×109/L) |
|
|
0.195 |
|
|
0.321 |
|
<50 |
14(56%) |
9(37.5%) |
|
10(40%) |
13(54.2%) |
|
|
>50 |
11(44%) |
15(62.5%) |
|
15(60%) |
11(45.8%) |
|
|
Hb(g/L) |
|
|
0.674 |
|
|
0.879 |
|
<70 |
14(56%) |
12(50%) |
|
13(52%) |
13(54.2%) |
|
|
>70 |
11(44%) |
12(50%) |
|
12(48%) |
11(45.8%) |
|
|
ANC (×109/L) |
|
|
0.199 |
|
|
0.889 |
|
<1 |
15(60%) |
10(41.7%) |
|
13(52%) |
12(50%) |
|
|
>1 |
10(40%) |
14(58.3%) |
|
12(48%) |
12(50%) |
|
|
WHO subtype |
|
|
0.009 |
|
|
0.396 |
|
MDS-SLD |
2(8%) |
1(4.2%) |
|
1(4%) |
2(8.3%) |
|
|
MDS-MLD |
9(36%) |
13(54.2%) |
|
11(44%) |
11(45.9%) |
|
|
MDS-EB |
4(16%) |
9(37.5%) |
|
5(20%) |
8(33.3%) |
|
|
s-AML |
10(40%) |
1(4.2%) |
|
8(32%) |
3(12.5%) |
|
|
IPSS |
|
|
0.011 |
|
|
0.258 |
|
low+INT1 |
9(36%) |
14(58.3%) |
|
10(40%) |
13(54.2%) |
|
|
high+INT2 |
6(24%) |
9(37.5%) |
|
7(28%) |
8(33.3%) |
|
|
s-AML |
10(40%) |
1(4.2%) |
|
8(32%) |
3(12.5%) |
|
|
Cytogenetics |
|
|
0.312 |
|
|
>0.999 |
|
Favorable |
15(60%) |
13(54.2%) |
|
14(56%) |
14(58.3%) |
|
|
Intermediate |
0(0%) |
3(12.5%) |
|
1(4%) |
2(8.3%) |
|
|
Unfavorable |
6(24%) |
8(33.3%) |
|
7(28%) |
7(29.2%) |
|
|
PLT: Platelets; Hb: Hemoglobin; ANC: Absolute neutrophil counts; low+INT1, Low risk and intermediate I risk; high+INT2, High risk and intermediate II risk. |
||||||
Table II: The relative expression of ANXA1 and DICER1 in subgroups of MDS and normal controls.
|
Group |
Patients (N=61) |
ANXA1 Expression |
DICER1 Expression |
|
MDS groups |
n=49 |
0.534(0.589) |
0.822(1.419) |
|
Relatively low-risk group |
n=23 |
0.610(0.492) |
0.952(1.612) |
|
Relatively high-risk group |
n=15 |
0.624(0.596) |
0.920(1.326) |
|
s-AML group |
n=11 |
0.252(0.057) |
0.322(1.425) |
|
Normal controls |
n=12 |
1.150(0.976) |
2.342(3.209) |
There was no correlation between ANXA1 expression and other clinical parameters, including gender, cytogenetics, hemoglobin levels, platelet counts and ANC nevertheless. In like manner, however, there was no relevance between DICER1 expression and these clinical parameters. During the 84-month follow-up, there was no statistically significant difference in overall survival or patient outcome between high expression group and low expression group of ANXA1 or DICER1 (p>0.05).
DISCUSSION
MDS is a highly heterogeneous hematopoietic malignancy with a high risk of transformation to AML. At present, the occurrence and progression of MDS are complex multi-gene, multi-stage pathological processes, and its pathogenesis remains elusive. DICER1, belongs to RNase III family, is extensively expressed in various tissues and plays a crucial part in the maturation of miRNA. Accumulated evidence has indicated that DICER1 expression is different among tumors, and varies according to the development stages in the same tumor. For instance, DICER1 was down-regulated in liver cancer, cervical cancer, ovarian cancer 5 and breast cancer,6 while over-expressed in cutaneous melanoma,7 prostate cancer8 and rectal cancer.
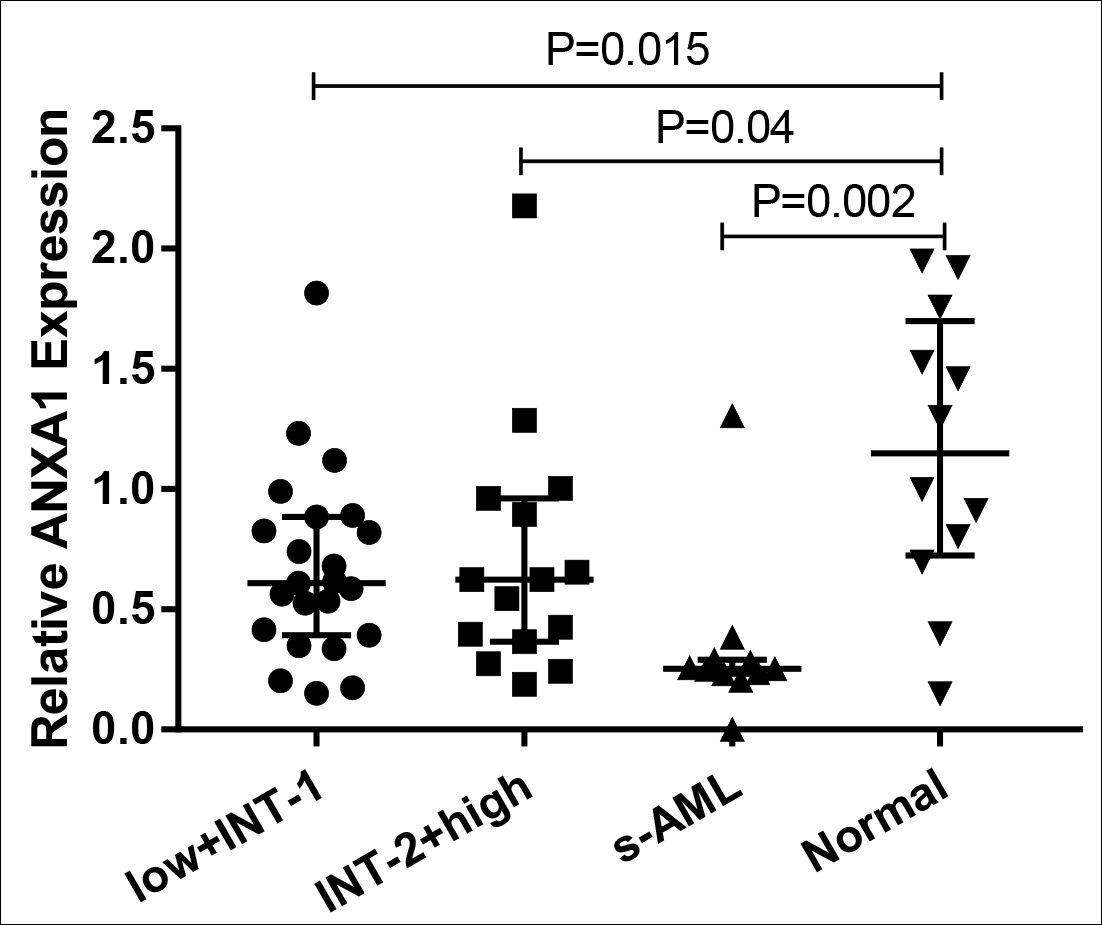 Figure 1A: The relative expression of ANXA1 in each MDS subgroup and normal controls. low+INT-1, low risk+ intermediate risk I. INT-2+high: intermediate risk II+ high risk.
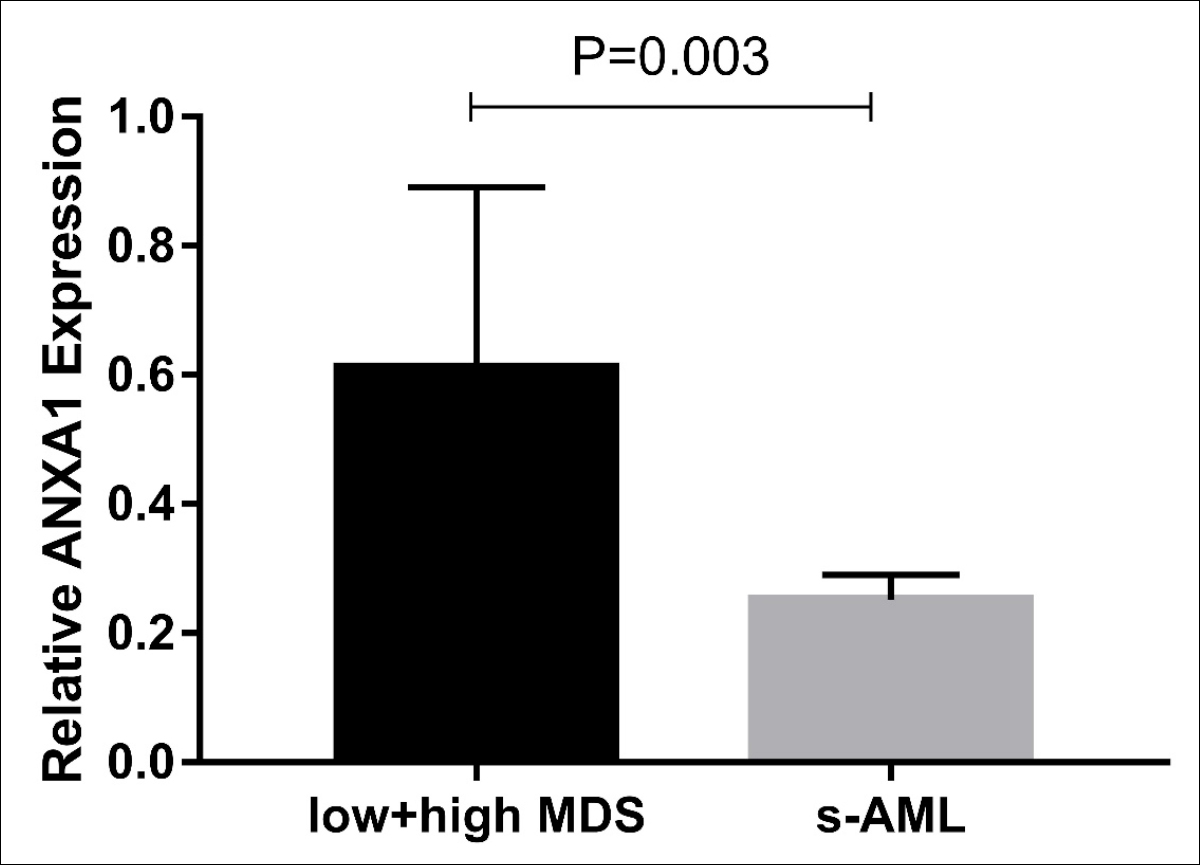 Figure 1B: The relative expression of ANXA1 in relatively low + high risk MDS groups and s-AML group.
In the current study, bone marrow DICER1 expression in MDS patients was significantly down-regulated compared to normal controls. These results were consistent with other studies regarding MDS. Hakan et al. found that DICER1 expression in multipotent mesenchymal stem cells from MDS and AML patients was lower than healthy controls, and gradually decreased from healthy controls to AML. Some differentially expressed miRNAs suggested that DICER1 may be involved in the pathogenesis of MDS and AML, which may become a new target gene for therapy.9 In addition, Raaijmakes et al. discovered that the specific deletion of DICER1 in mouse osteoprogenitor cells can give rise to hemocytopenia, myelodysplasia and induce into MDS and s-AML.10 Subsequently, studies confirmed that DICER1 gene expression in MDS patients was lower than healthy controls.4,11
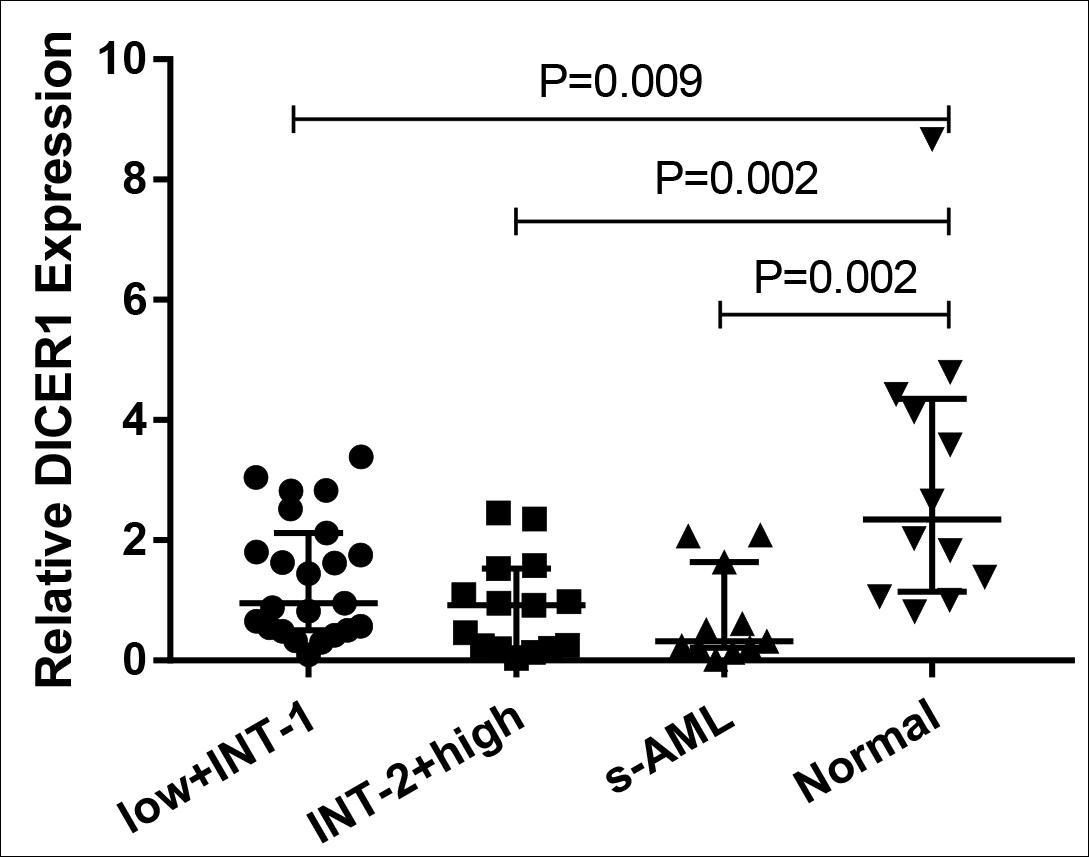 Figure 1C: The relative expression of DICER1 in each MDS subgroup and normal controls.
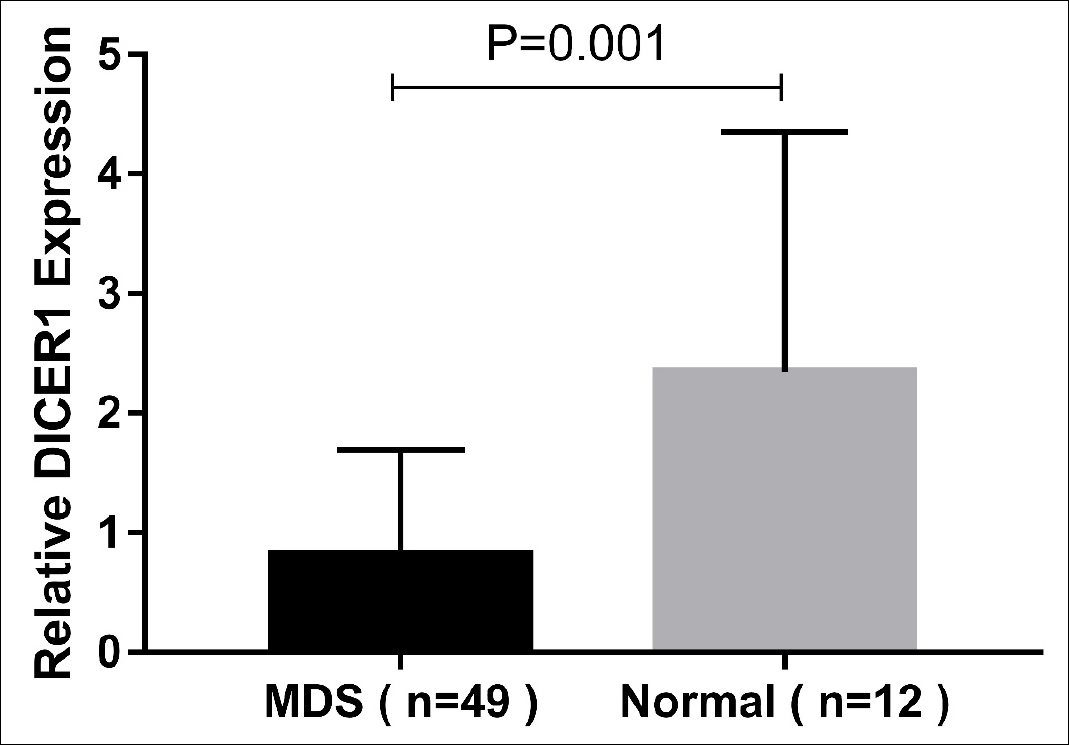 Figure 1D: The relative expression of DICER1 in three MDS groups and normal controls.
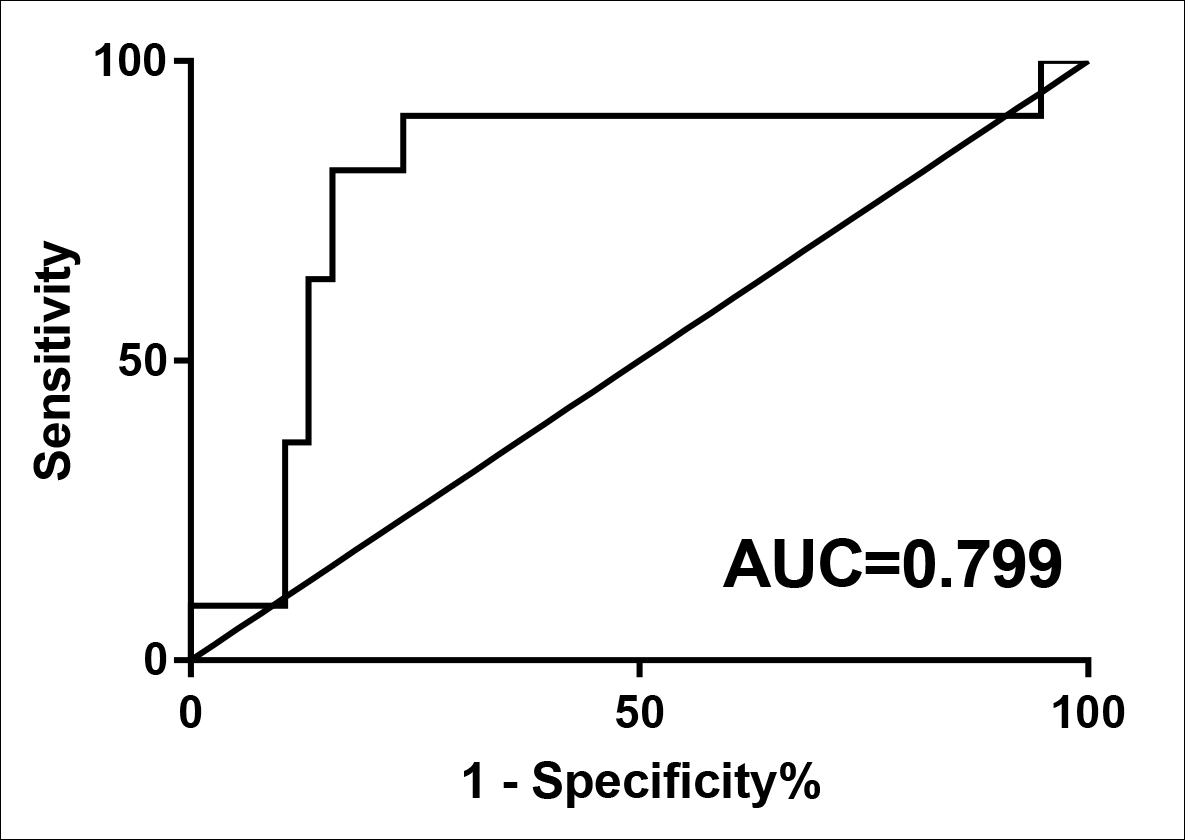 Figure 2: ROC analysis using ANXA1 for screening AML cases from MDS patients.
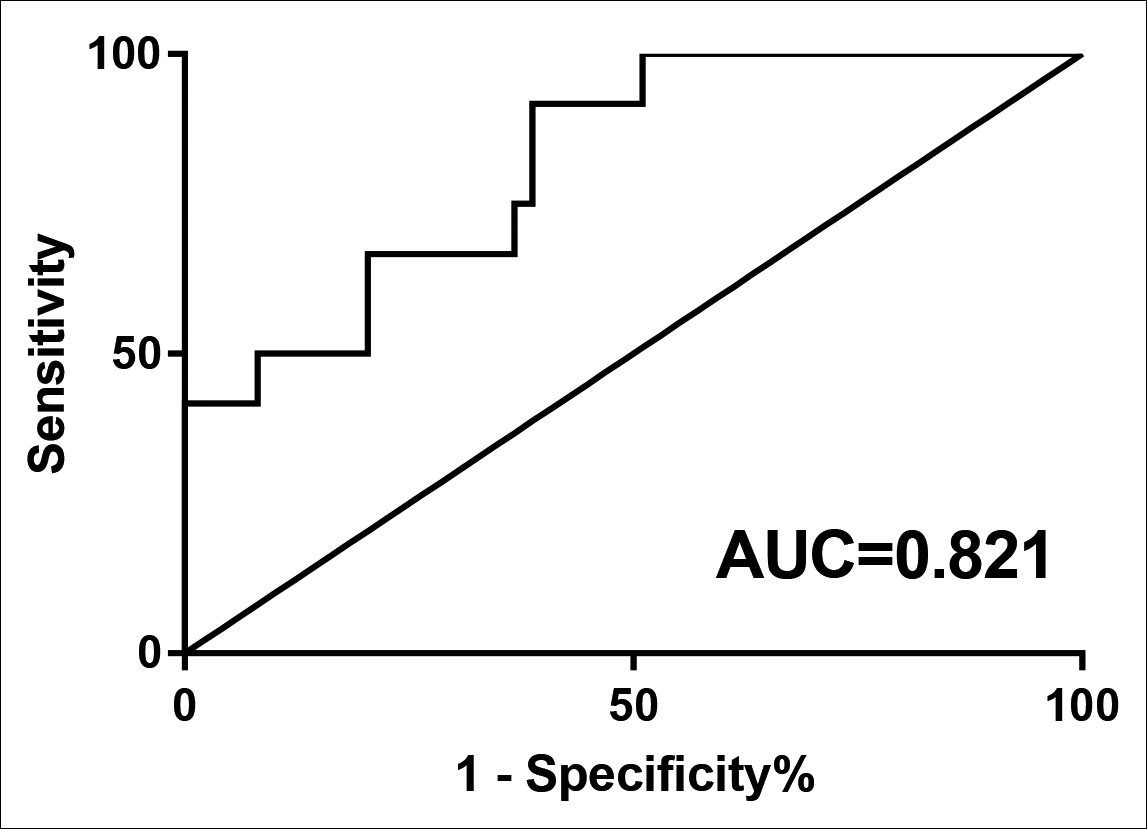 Figure 3: ROC analysis using DICER1 for separating MDS patients from normal controls.
In this study bone marrow DICER1 expression in MDS and s-AML patients was greatly lower than healthy controls, especially in s-AML. In MDS subjects, the expression level of DICER1 was significantly down-regulated. ROC analysis showed that DICER1 low-expression could distinguish MDS cases from normal controls. Thus, we believe that DICER1 may be a potential biomarker for accurate diagnosis for MDS.
ANXA1, a calcium-dependent phospholipid-binding protein, is the first member of the Annexin family. Since its discovery, ANXA1 was considered to involve in anti-inflammatory response, cell differentiation, proliferation and apoptosis, signal regulation and other cellular biological activities.12 Recent studies have shown that ANXA1 may play multiple roles in the occurrence and development of malignancies at different levels (from cancer initiation to metastasis).13,14
ANXA1 expression in various types of tumors was contradictory.Gao. et al. showed that ANXA1 was down-expressed in gastric and bile duct cancers. Forced-expressed ANXA1 in gastric cancer cells strongly restrained cell growth and modulated COX-2 expression.15 Similar studies were observed in other tumors.16-18 However, ANXA1 was up-expressed in some cancer types such as hepatocellular carcinoma, non-small cell lung cancer, melanoma and esophageal cancer.19-22
As for hematologic malignancies, Sabran et al. found that ANXA1 expression in acute lymphoblastic leukemia (Jurkat), AML (U937) and chronic myeloid leukemia (K562) cell lines were visibly higher compared to peripheral blood mononuclear cells (PBMCs) from normal controls. Moreover, ANXA1 expression in U937 cells was lower than in K562 and Jurkat cells, indicating that ANXA1 can be used as a biomarker to distinguish AML from healthy people.23 The expression of ANXA1 was up-regulated in hairy cell leukemia (HCL). Brunangelo.et al did immunostaining in 500 B-cell tumors with a specific anti-ANXA1 monoclonal antibody and demonstrated that ANXA1 expression was unique to HCL.24
From these results, it is speculated that the expression of ANXA1 is abnormal in MDS. However, studies on ANXA1 in bone marrow of MDS patients are scant. This study showed that compared with relatively low-risk MDS group, ANXA1 expression was down-regulated in relatively high-risk MDS patients. Furthermore, in s-AML patients, the expression was more decreased. As a result, ANXA1 expression in MDS patients is negatively correlated with the risk of leukemia transformation. At present, the IPSS risk score of MDS is mainly determined by the percentage of BM blasts, cytogenetics and peripheral blood. Hence, this study analysed the correlation between the relative expression of ANXA1 and these clinical parameters. Results indicated that ANXA1 expression in MDS patients was negatively correlated with the percentage of BM blasts, IPSS and WHO stratification, but did not correlate with cytogenetics and peripheral blood. As the percentage of BM blasts, IPSS and WHO stratification are important indices for MDS disease classification, risk classification, disease progression and prognosis, low expression of ANXA1 may contribute to the disease progression and poor prognosis in MDS, suggesting that ANXA1 may be conducive to early diagnosis and management of MDS. In addition, the ROC curve suggested that ANXA1 down-expression may lead to the occurrence of AML, which can be used to distinguish s-AML patients from MDS patients. In conclusion, we speculate that ANXA1 may play a crucial role in the transformation from MDS to AML.
Unfortunately, the univariate survival analysis showed that the expression of ANXA1 or DICER1 was not correlated with prognosis. The reasons may be sufficient sample size and the therapy of MDS patients is not unified, thus the survival time cannot be compared. Next, the authors will expand the sample size, strictly screen and follow up the eligible patients and then analyze the correlation between the disease prognosis and ANXA1 or DICER1.
CONCLUSION
Taken together, this data provide a convincing evidence that bone marrow ANXA1 and DICER1 expressions in MDS patients are significantly decreased compare to healthy controls, and their abnormal expressions may play an important role in MDS pathogenesis. ANXA1 can be used as a potential biomarker to predict the leukemia transformation risk of MDS, and DICER1 may contribute to the diagnosis of MDS.
FUNDING:
This work was supported by the National Natural Science Foundation of China (No. 81560028 and No.81160072).
CONFLICT OF INTEREST:
The authors have no conflicts of interest to declare.
ETHICAL APPROVAL:
This study was approved by the Human Ethics Committee of The First Affiliated Hospital of Guangxi Medical University, China. (2020, KY-E-101).
AUTHORS’ CONTRIBUTION:
WW, ZL: Conception or design of the work.
WW, QX, XL, JW: Acquisition and analysis of data.
WW, CW, QX, XL, JW: Drafting the work.
CW, ZL: Final approval of the version to be published.
REFERENCES
- Killick SB, Bown N, Cavenagh J, Dokal I, Foukaneli T, Hill A, et al. Guidelines for the diagnosis and management of adult aplastic anaemia. Br J Haematol 2016; 172(2):187-207. doi:10.1111/bjh.13853.
- Wang J, Chen J, Sen S. MicroRNA as Biomarkers and Diagnostics. J Cell Physiol 2016; 231(1):25-30. doi:10.1002/ jcp.25056.
- Wu SG, Chang TH, Liu YN, Shih JY. MicroRNA in Lung Cancer Metastasis. Cancers (Basel) 2019; 11(2):265. doi:10.3390/cancers11020265.
- Santamaría C, Muntión S, Rosón B, Blanco B, López-Villar O, Carrancio S, et al. Impaired expression of DICER, DROSHA, SBDS and some microRNAs in mesenchymal stromal cells from myelodysplastic syndrome patients. Haematologica 2012; 97(8):1218-24. doi:10.3324/haematol.2011.054437.
- Zhu Y, Cai L, Guo J, Chen N, Yi X, Zhao Y, et al. Depletion of Dicer promotes epithelial ovarian cancer progression by elevating PDIA3 expression. Tumour Biol 2016; 37(10):14009-23. doi:10.1007/s13277-016-5218-4.
- Poursadegh Zonouzi AA, Nejatizadeh A, Rahmati-Yamchi M, Fardmanesh H, Shakerizadeh S, Poursadegh Zonouzi A, et al. Dysregulated expression of Dicer in invasive ductal breast carcinoma. Med Oncol 2015; 32(7):203. doi:10.1007/s12032-015-0643-6.
- Hoffend NC, Magner WJ, Tomasi TB. The modulation of Dicer regulates tumor immunogenicity in melanoma. Oncotarget 2016; 7(30):47663-73. doi:10.18632/ oncotarget.10273.
- Bian XJ, Zhang GM, Gu CY, Cai Y, Wang CF, Shen YJ, et al. Down-regulation of dicer and ago2 is associated with cell proliferation and apoptosis in prostate cancer. Tumour Biol 2014; 35(11):11571-8. doi:10.1007/s13277-014-2462-3.
- Ozdogan H, Gur Dedeoglu B, Oztemur Islakoglu Y, Aydos A, Kose S, Atalay A, et al. DICER1 gene and miRNA dysregulation in mesenchymal stem cells of patients with myelodysplastic syndrome and acute myeloblastic leukemia. Leuk Res 2017; 63:62-71. doi:10.1016/ j.leukres.2017.10.006.
- Raaijmakers MH, Mukherjee S, Guo S, Zhang S, Kobayashi T, Schoonmaker JA, et al. Bone progenitor dysfunction induces myelodysplasia and secondary leukaemia. Nature 2010; 464(7290):852-7. doi:10.1038/nature08851.
- Geyh S, Oz S, Cadeddu RP, Fröbel J, Brückner B, Kündgen A, et al. Insufficient stromal support in MDS results from molecular and functional deficits of mesenchymal stromal cells. Leukemia 2013; 27(9):1841-51. doi:10.1038/ leu.2013.193.
- Tebar F, Gelabert-Baldrich M, Hoque M, Cairns R, Rentero C, Pol A, et al. Annexins and endosomal signaling. Methods Enzymol 2014; 535:55-74. doi:10.1016/B978- 0-12-397925- 4.00004-3.
- Sheikh MH, Solito E. Annexin A1: Uncovering the many talents of an old protein. Int J Mol Sci 2018; 19(4):1045. doi:10.3390/ijms19041045.
- Boudhraa Z, Bouchon B, Viallard C, D'Incan M, Degoul F. Annexin A1 localization and its relevance to cancer. Clin Sci (Lond) 2016; 130(4):205-20. doi:10.1042/CS20150415.
- Gao Y, Chen Y, Xu D, Wang J, Yu G. Differential expression of ANXA1 in benign human gastrointestinal tissues and cancers. BMC Cancer 2014; 14:520. doi:10.1186/ 1471-2407-14-520.
- Zhu DW, Yang X, Yang CZ, Ma J, Liu Y, Yan M, et al. Annexin A1 down-regulation in oral squamous cell carcinoma correlates to pathological differentiation grade. Oral Oncol 2013; 49(6):542-50. doi:10.1016/j.oraloncology.2013.01.002.
- Mu D, Gao Z, Guo H, Zhou G, Sun B. Sodium butyrate induces growth inhibition and apoptosis in human prostate cancer DU145 cells by up-regulation of the expression of annexin A1. PLoS One 2013; 8(9):e74922. doi:10.1371/journal.pone.0074922.
- Álvarez-Teijeiro S, Menéndez ST, Villaronga MÁ, Pena-Alonso E, Rodrigo JP, Morgan RO, et al. Annexin A1 down-regulation in head and neck squamous cell carcinoma is mediated via transcriptional control with direct involvement of miR-196a/b. Sci Rep 2017; 7(1):6790. doi:10.1038/ s41598-017-07169-w.
- Lin Y, Lin G, Fang W, Zhu H, Chu K. Increased expression of annexin A1 predicts poor prognosis in human hepatocellular carcinoma and enhances cell malignant phenotype. Med Oncol 2014; 31(12):327. doi:10.1007/s12032-014-0327-7.
- Fang Y, Guan X, Cai T, Long J, Wang H, Xie X, et al. Knockdown of ANXA1 suppresses the biological behavior of human NSCLC cells in vitro. Mol Med Rep 2016; 13(5):3858-66. doi:10.3892/mmr.2016.5022.
- Boudhraa Z, Rondepierre F, Ouchchane L, Kintossou R, Trzeciakiewicz A, Franck F, et al. Annexin A1 in primary tumors promotes melanoma dissemination. Clin Exp Metastasis 2014; 31(7):749-60. doi:10.1007/ s10585- 014-9665-2.
- Han G, Lu K, Huang J, Ye J, Dai S, Ye Y, et al. Effect of Annexin A1 gene on the proliferation and invasion of esophageal squamous cell carcinoma cells and its regulatory mechanisms. Int J Mol Med 2017; 39(2):357-63. doi:10.3892/ijmm.2016.2840.
- Sabran A, Kumolosasi E, Jantan I. Effects of annexin A1 on apoptosis and cell cycle arrest in human leukemic cell lines. Acta Pharm 2019; 69(1):75-86. doi:10.2478/acph- 2019-0005.
- Falini B, Tiacci E, Liso A, Basso K, Sabattini E, Pacini R, et al. Simple diagnostic assay for hairy cell leukaemia by immunocytochemical detection of annexin A1 (ANXA1). Lancet 2004; 363(9424):1869-70. doi:10.1016/S0140- 6736(04) 16356-3.