CT Chest Severity Score for COVID 19 Pneumonia: A Quantitative Imaging Tool for Severity Assessment of Disease
By Sana Sayeed, Belqees Yawar Faiz, Samreen Aslam, Laiba Masood, Rohama SaeedAffiliations
doi: 10.29271/jcpsp.2021.04.388ABSTRACT
Objective: To determine a cut-off value of Chest CT severity score (CT-SS) in order to discriminate between the clinical types of COVID-19 pneumonia.
Study Design: Observational study.
Place and Duration of Study: Department of Radiology, Shifa International Hospital, from 1st March to June 30th, 2020.
Methodology: One hundred and three consecutive patients’ RT PCR positive for COVID-19 were included. Two consultant radiologists, with experience of 7 to 10 years in body imaging, evaluated their HRCT studies in consensus and calculated the CT severity score. A scoring of all 20 individual regions in each lung were assigned by the radiologists attributing a score of 0, 1 or 2 to each region, if parenchymal opacification was none, less than 50%, or 50% or more, respectively. The CT severity score was a summation of scores of all 20 regions of both lungs combined with a range of 0 to 40 points. The scores were compared for clinically mild and severe disease.
Results: Significant differences were noted regarding the scoring of lung opacity in mild and severe groups in each lung segment, p <0.05. The most significantly involved segments were right lower lobe’s medial and lateral basal segment, left upper lobe’s superior lingular segment and left lower lobe’s medial basal and lateral basal segments. To discriminate mild versus severe disease, CT-SS threshold value turned out to be 19.5
Conclusion: CTSS may be of value for a prompt and objective means of assessing the degree of severity and disease burden in lungs.
Key Words: COVID-19, COVID-19 diagnosis, Pneumonia, Novel coronavirus, CT severity score, Respiratory tract infection, Triage, Pandemic, RT-PCR, SARS-COV 2, Outbreak.
INTRODUCTION
The world was hit by a new outbreak of pneumonia, caused by a novel Coronavirus, by the end of 2019, which was named severe acute respiratory syndrome coronavirus 2 (SARS-CoV-2).1 Until mid-June, the notified cases in Pakistan were at their peak, reaching the figure of newly diagnosed 6,825 cases per day. Since then, there has been a continuous decline and as of the end of July, the total number of confirmed cases was 276K, according to the Pakistan government official website of NDMA. There have been reports of the second wave hitting some areas of the world by SARS-CoV-2.
The main proposed route of transmission of COVID 19 infection is via respiratory droplets,2 as well as physical contact. The disease progression can be rapid and sometimes results in severe respiratory distress syndrome warranting intensive care unit admission (26–32%), and death (4.3–15%). Computed tomography (CT) has been used as an important adjunct to RT-PCR for diagnosing COVID-19 pneumonia.3-9 There is a limitation of this molecular testing when the viral load is less, RT-PCR can be falsely negative, while chest CT demonstrates abnormalities.7,9,10 Hence, chest computed tomography (CT), in particular, high-resolution computed tomography (HRCT) had been proven the workhorse of the radiologist in the current pandemic infection.10-13 It represents an important surrogate tool in identifying patients with COVID-19 infections in the symptomatic phase with nonspecific clinical symptoms.11 This also helps in screening the patient getting admitted, for triage, detecting cases without any specific symptoms and also to assess the load of infection.14-18
The rationale of this study was to correlate the clinical and HRCT features in patients with early COVID-19 infection retrospectively and to detect severe cases to facilitate triage, so that appropriate management could be directed to the severe ones as well as identification and early isolation of the infected ones coming to hospitals could be made. This is also important from the point of view that the second and now the third wave of COVID-19 infection is suspected requiring better preparation to face this recurring threat. One can deduce appropriate screening and monitoring protocols from the experiences of the first wave of this pandemic.
The objective of this study was to determine a cut-off value of Chest CT severity score (CT-SS) in order to discriminate between the clinical types of COVID-19 pneumonia.
METHODOLOGY
Approval from the Institutional Review Board and Ethical Committee at Shifa International Hospitals, Islamabad, Pakistan was sought. After getting approval, a total of 103 consecutive patients from March 1st, 2020 to June 30th, 2020 were included in the study. All of these were RT-PCR positive for COVID 19. Their high-resolution CT was performed at the Radiology Department, either at the time of admission from the Emergency Department or while admission in inpatient departments.
From a total of 103 patients, 21.36 % were females, while 78.64% were males. All patients, having lung malignancy, known tuberculosis or collapse/atelectasis, were excluded from the study. The patients were divided into two groups, i.e. mild and severe groups; with mild cases having respiratory symptoms such as fever and cough, with opacities seen on chest imaging. Severe patients were grouped on the basic of either respiratory distress (RR > 30 cycles/minutes), or oxygenation saturation resting < or equal to 93%, or respiratory failure, needing mechanical ventilation.
All HRCT were performed on 320 slice CT scanner dedicated for known or suspected COVID patients. The imaging parameters were tube current of 20 mAs, voltage 100 kVp., slice thickness of 1mm and scan time of 3.32 seconds. All patients were supine and CT acquisition made in full inspiration with recorded verbal commands from costophrenic angle to the apex of the lung. Non-contrast technique was used in the acquisition of CT images. Non-contrast technique was used in the acquisition of CT images. Kernel BI57 for lungs and Kernel Bf37 for mediastinum were used with SAFIRE strength 2 for both.
Two consultant radiologists, having experience of 7 to 10 years in body imaging, evaluated the HRCT studies in consensus. The study was reviewed on PACS (picture archiving computerised system) in multiple window settings; a window width of 1200 HU and 600 HU level was used for lung and window width of 350 HU and 50 HU level was used for mediastinum, images were also reviewed in MPR multiplanner reconstruction on PACS.
CT severity scoring was done on the first scan of the patient on admission. The anatomical structures of 18 segments of lungs were divided into 20 regions, the apicoposterior segment of the left upper lobe was divided into apical and posterior regions, while anteromedial basal segment of left lower lobe was divided into anterior and medial basal regions. Scoring of all the 20 individual regions was, hence, made subjectively by the radiologists attributing a score of 0, 1 or 2 to each region, if parenchymal opacification is none, less than 50% or 50% or more, respectively. The CT severity score is the summation of all scores of all 20 regions of both lungs combined with a range from 0 to 40 points.1
Data analysis was conducted using Statistical Package for Social Sciences Software (SPSS Version 25, SPSS Inc., Chicago, IL, USA). Descriptive statistics, i.e. frequency distribution, percentages, mean, standard deviation, median and interquartile range (IQR) were calculated for the study variables. A Chi-square or Fisher Exact test was used to assess the relationship between categorical variables. The normality of quantitative data was checked, using the Shapiro Wilk Test. A Wilcoxon rank-sum test was used to compare the difference of left lung, right lung and total score between the mild group and the severe group. A paired sample t-test along with Wilcoxon matched-pairs signed-rank test was used to compare the difference of scores between the lower lung and middle-upper lung, left lung and right lung. Statistical significance was accepted at p <0.05. ROC analysis was applied and sensitivity and specificity were calculated.
RESULTS
Table I shows the clinical and demographic data of the 103 patients, the mean age was 30.55 ± 7.73years, with 81 males (78.64%) and 22 females (21.36%), respectively. Of the 103 patients, 20 (19.40%) patients were from the mild group, and 83 (80.60%) were from the severe group. Thirteen (65%) males were of the mild group, while 68 (81.9%) were of the severe group. While among females, 7 (35%) were of the mild group and 15 (18.1%) fell in the severe group (p = 0.128).Of the less than 50 years age group, 8 were from the mild group, while 21 were in the severe group; while in the 50 years and above group, 62 patients belonged to the severe group (p = 0.190). None from the mild group needed mechanical ventilation, while 24 patients of a total of 83 of the severe group needed mechanical ventilation.
In the severe group, overall lymphocytes were reduced (p = 0.115) and neutrophils were increased (p = 0.043). CRP was also raised in the severe group (p = 0.071). SO2% was reduced in the severe group (IQR: 80.5-92), while in the mild group, there is no significant reduction (IQR: 94-96.75).
The number of patients with involvement of each segment are acquired. The significant difference was noted regarding the scoring of lung opacity in mild and severe groups in each lung segment, p <0.05 (significant variables were right lower lobe’s medial and lateral basal segment, left upper lobe’s superior lingular segment and left lower lobe’s medial basal and lateral basal segments).
Table I: Demographic and clinical data of patients (N = 103).|
Description |
Mild |
Severe |
p-value |
|
N (%) 20 |
N (%) 83 |
||
|
Gender |
|||
|
Male |
13 (65) |
68 (81.9) |
0.128 |
|
Female |
7 (35) |
15 (18.1) |
|
|
Age |
|||
|
<50 years |
8 (40) |
21 (25.3) |
0.190 |
|
50 years and above |
12 (60) |
62 (74.7) |
|
|
Mech vent |
|||
|
Yes |
0 (0.0) |
24 (28.9) |
0.003* |
|
*No |
20 (100) |
59 (71.1) |
|
|
RR/min |
18.50 (18-20) |
25.00 (21-29.5) |
<0.001* |
|
CRP |
29.50 (18-57) |
71.50 (18.28-116) |
0.071 |
|
SO2 (%) |
95.00 (94-96.75) |
88 (80.5-92 |
<0.001* |
|
Lympho |
18.00 (11.5-24) |
12.00 (8-20.75) |
0.115 |
|
Neutro |
72.00 (60.25-81.50) |
81 (71-88) |
0.043* |
|
*p-value ≤0.05 were considered statistically significant. |
|||
Table II: Comparison of left lung score and right lung score, lower lung score and upper-middle lung score.
|
Variable |
Left Lung |
Right Lung |
P-value |
Middle-upper Lung |
Lower Lung |
P-value |
|
Mild (20) |
9.85±3.33 |
10.50±3.50 |
0.358 |
9.20±4.01 |
11.15±3.25 |
0.042* |
|
Severe (83) |
12.00 (8-17) |
13.00 (8-16) |
0.042* |
12.00 (7-15) |
13.00 (9-18) |
0.002* |
|
*P values less than 0.05 were considered statistically significant. |
||||||
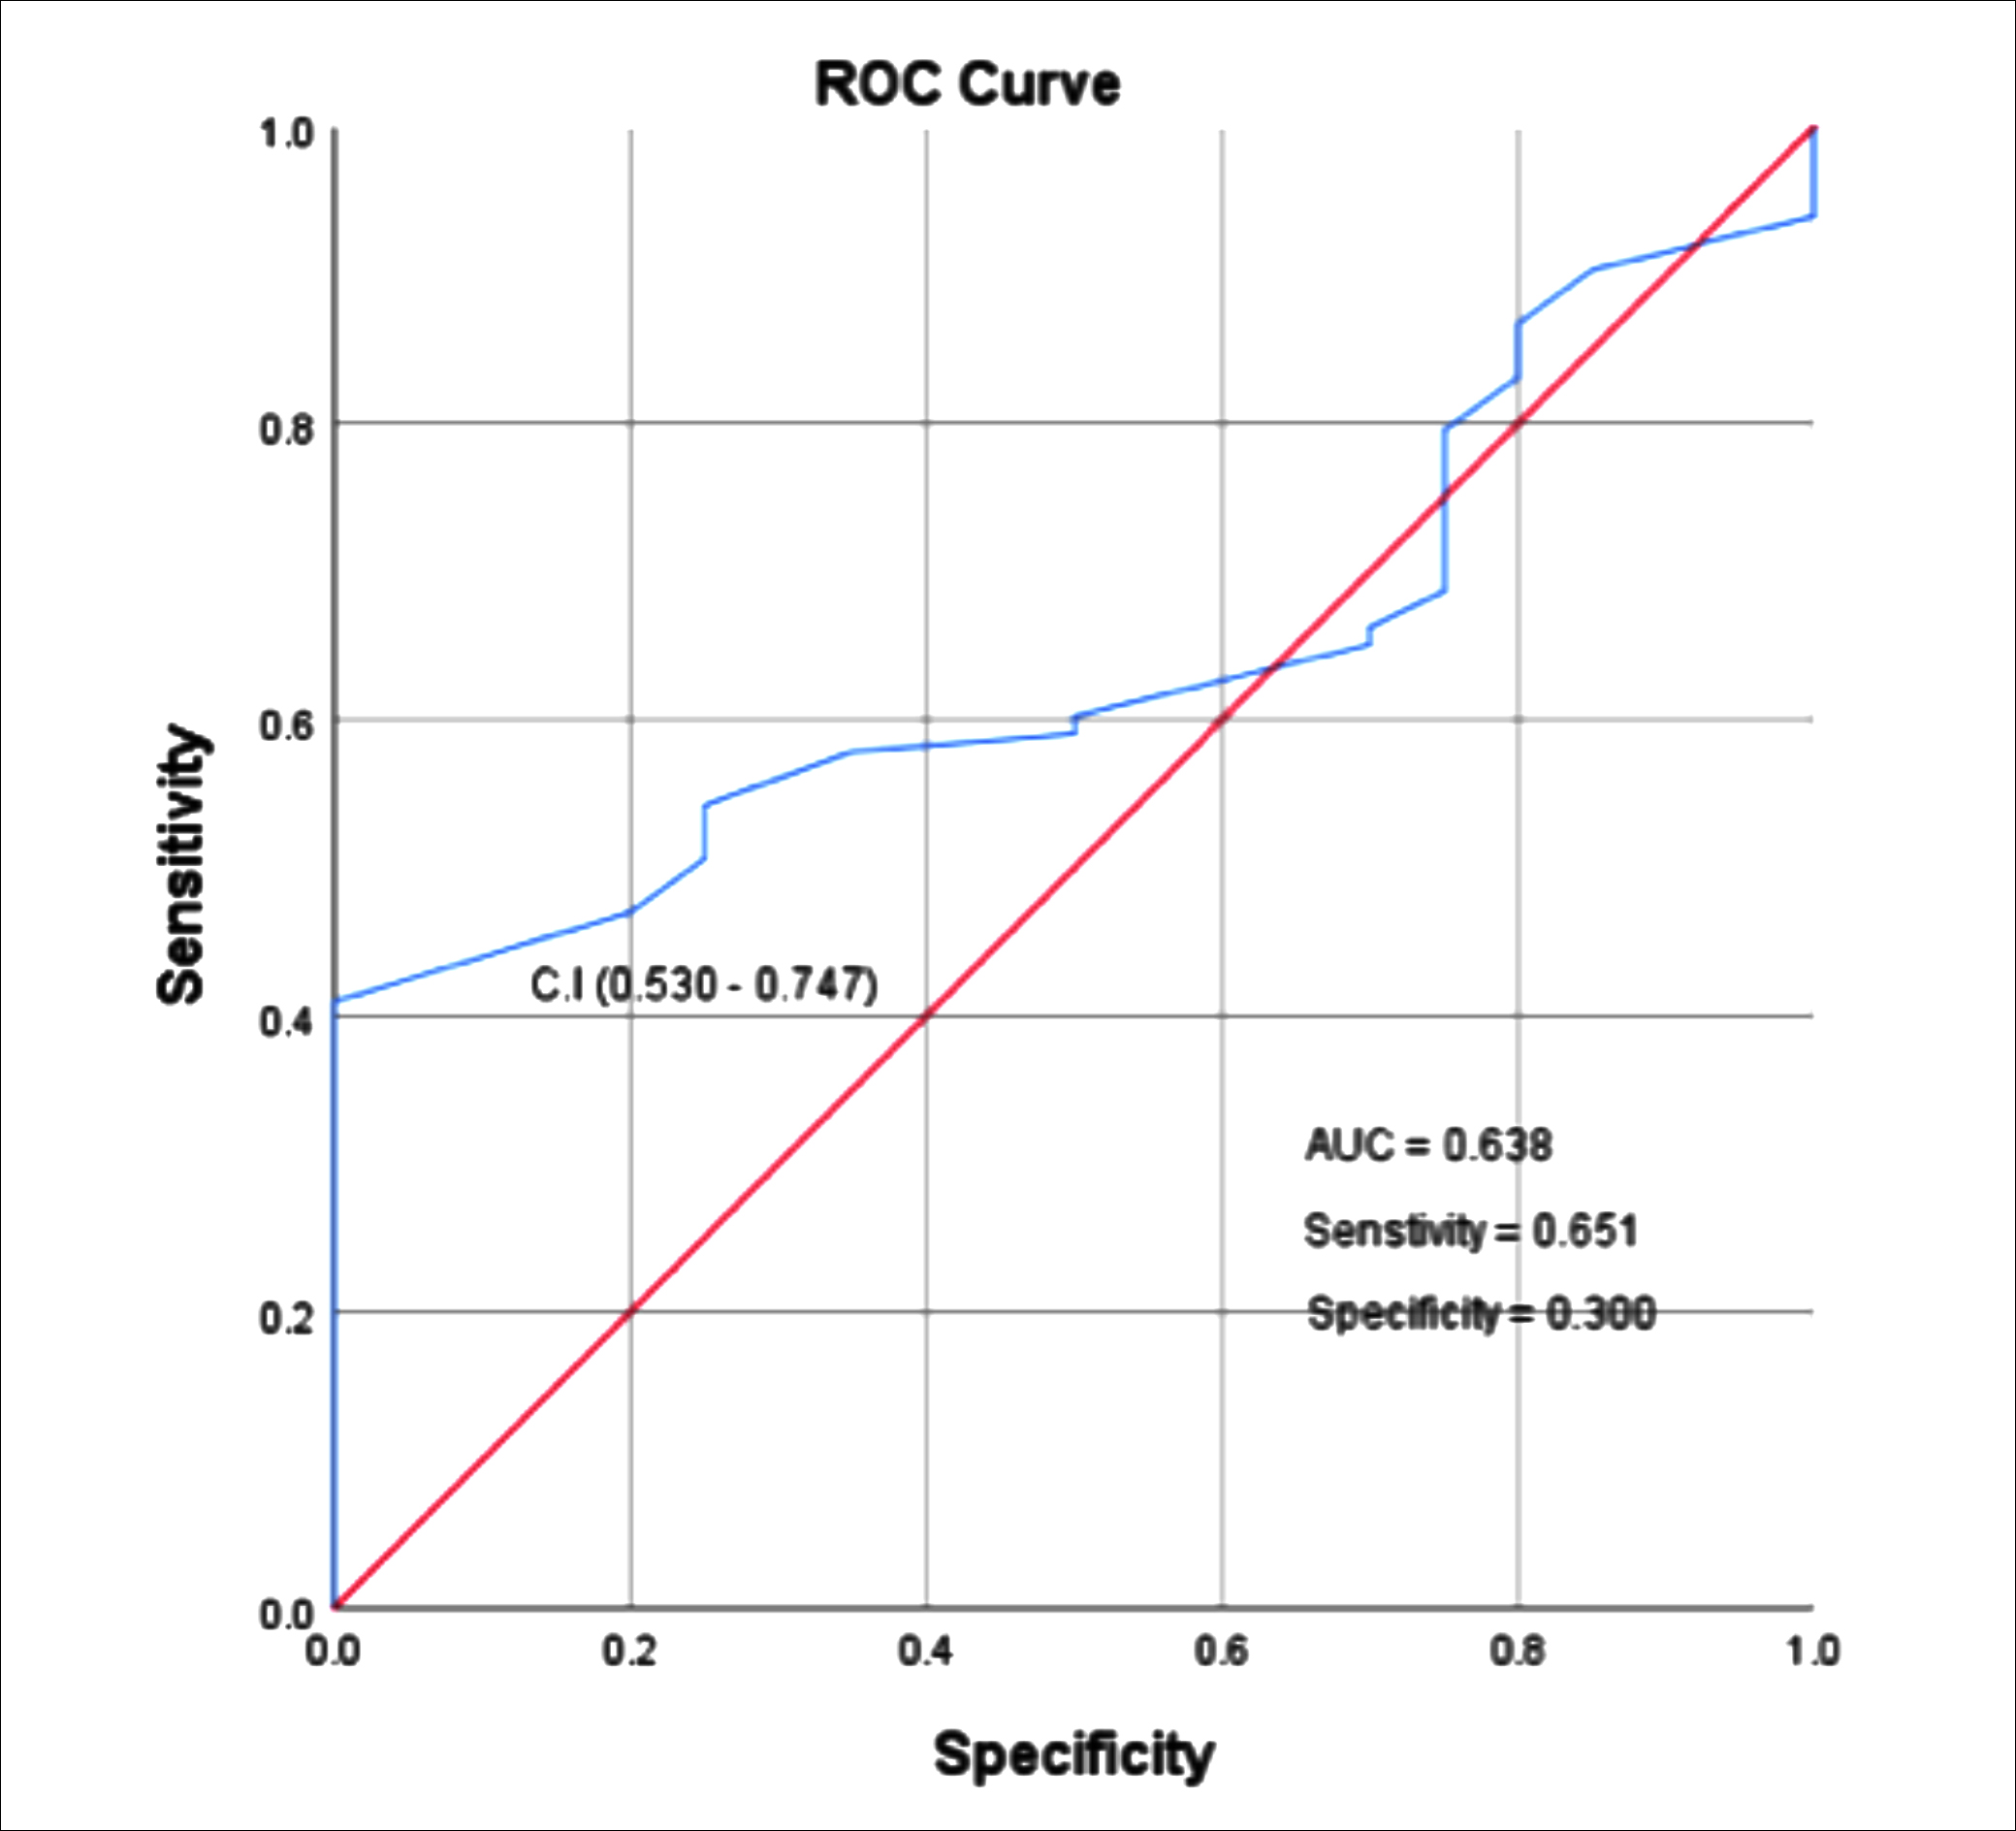 Figure 1: ROC curve for CT-SS.
Overall, the posterior basal segment of lower lobes (right 98/103, left 92/103), posterior segments of upper lobes (right 89/103, left 91/103) lateral basal segments (Right 91/103, left 86/103), apical segments of both upper lobes and lower lobes (right 86/103, left 72/103) were the most frequently involved regions.
Secondary CT findings, like pleural effusion, only one case in the severe group was found, one case of spontaneous pneumomediastinum also found in the severe group, while 6 patients had mediastinal lymphadenopathy in the severe group. No additional CT finding found in the mild group.
The lower lungs marked the higher score than the middle-upper lungs, while no statistical difference was found between right and left lung score. Furthermore, the difference of left lung [mild: 10.0(7.25-12.0) vs. severe: 12.0(8.0-17.0) p=0.104], right lung [mild: 10.5 (8.0-12.5) vs. severe: 13.0 (8.0-16.0) p=0.126] and total score [mild: 21.0(15.75-26.0) vs. severe: 27.0 (16.0-33.0) p=0.055] were insignificant (Table II).
Figure 1 shows the ROC curve, the area under the curve to differentiate the Mild and Severe groups is 0.638. The CT SS optimal cutoff or threshold value to identify the severe casesis 19.5. The sensitivity was 65.1% and specificity of 30.0%.
DISCUSSION
The coronavirus pandemic spread across the world and resulted in variable morbidity and mortality across the globe. This article is based on visual quantitative analysis of the severity of the disease in the lung parenchyma. This severity score is correlated with the patient’s clinical condition. This study aimed to find out the correlation between CT severity score and severity of clinical symptoms and disease burden in the local population.
On imaging, computed tomography (CT) manifestations of COVID-19 resemble those seen in viral pneumonias,19-23 with multifocal ground-glass opacities and consolidation in a peripheral distribution being the most common findings.12,14,15 These CT findings, though nonspecific, but in the proper clinical scenario, are of strategic importance since they can be used to confirm the diagnosis, assess disease burden, i.e. severity, evaluate the changes in severity, and modify the treatment plan as well as help to infer the prognosis.17,18
A linear relationship between CT severity score and symptomatology of the patients was noticed. These symptoms defined ICU admission and a hospital stay of these patients. This means that close collaboration of radiologist and pulmonologist can predict hospital stay, ICU admission and disease progression in these patients based on the burden of the disease.
The study involved 81 male and 22 female patients, and showed that 74 cases were above 50 years of age with only 29 below 50 years. A similar age distribution is noted for the population in the rest of the world.23,24 Pneumonia was graded as severe disease in 83 cases per clinical criteria. These patients showed widespread GGOS replacing normal air in alveoli with consolidation, having lower lobe involvement and posterior segments predominance as published in the data in rest of the world regarding pattern involvement of COVID pneumonia.14,24
All the cases with the severe disease do not require mechanical ventilation; only 24 cases required mechanical ventilation. These 24 cases showed CT severity scores above 19.5. Oxygen saturation in the severe group was also reduced as compared to the mild group in an average of 88% with the range of 51 to 98%, as compared to the mild group, which was around 95%.
Twenty cases had mild disease with fewer GGOS on CT scan. These cases didn’t require mechanical ventilation. Patients with mild disease were also not strictly O2 dependent and their O2 saturation remained above 93 percent.
The severity of disease and associated complications in the Pakistani population was noticed to be less frequent than what is described internationally.19,22 This study provides a good correlation between CT severity score and clinically evident disease burden. This also signifies the relation of CT severity score with oxygen dependency and respiratory rate in our population.
COVID-19 pneumonia-related overall hospitalisation, mortality and morbidity are relatively less severe in Pakistan. The reason this study has more patients falling in the severe group as compared to the mild group is because more patients with severe disease were admitted to the hospital; and this is one of the limitations of this study, especially regarding the cut-off value of CT severity score. When compared to one of the major international papers,1 with the CT-SS threshold to discriminate severe versus mild group, although it turned out to be the same, i.e. 19.5, the sensitivity and specificity are relatively lower when compared to Ran Yang et al1, where they have more mild cases and few severe cases.
This retrospective study had inherent limitations as no histological confirmation of the burden of the disease was sought, operating under the assumption that the degree of opacification signifies COVID disease. There was no determination of the duration of disease when presenting to the hospital. The third factor was since the setup had been a tertiary care unit, so mostly the patients admitted to this hospital were those who had a clinically severe form of the disease. Moreover, since CT severity score is established within a small group of experienced radiologists, the degree of consistency needs to be tested among the larger group of investigators having a different level of experiences; and furthermore, CT-SS needs to be validated with larger cohorts and with studies performed at various other centres in the country.
CONCLUSION
In a nutshell, the present study determines a semi-quantitative way of assessing the severity of COVID-19 in the initial high-resolution chest CT. The CT-SS score of 19.5 in this study may suggest that the severe and critical forms of the disease, with a fair degree of confidence, can be detected. So, CT-SS can be potentially a tool for efficiently triaging the patients in need of intensive care. This is particularly important in countries like Pakistan, where need to triage large bulk of patients fast, timely allocating them to intensive care with limited capability of PCR testing and resources with better insight about the degree of disease burden in patients.
EITHICAL APPROVAL:
The Ethics Committee at Shifa International Hospitals, Islamabad, Pakistan approved the study.
PATIENTS’ CONSENT:
As the study was designed retrospectively, data was collected from clinical archives after ethical approval.
CONFLICT OF INTEREST:
The authors declared no conflict of interest.
AUTHORS’ CONTRIBUTION:
SS, BYF, SA: Data collection, scoring, paper writing.
LM, RS: Data collection.
REFERENCES
- Yang R, Li X, Liu H, Zhen Y, Zhang X, Xiong Q, et al. Chest CT severity score: An imaging tool for assessing severe COVID-19. Radiology Cardiothoracic Imaging 2020; 2(2):e200047. doi.org/10.1148/ryct.2020200047.
- Chan JF, Yuan S, Kok KH, To KK, Chu H, Yang J, et al. A familial cluster of pneumonia associated with the 2019 novel coronavirus indicating person-to-person transmission: a study of a family cluster. Lancet 2020; 395 (10223):514-23. doi.org/10.1016/S0140-6736 (20) 30154-9.
- Corman VM, Landt O, Kaiser M, Molenkamp R, Meijer A, Chu DK, et al. Detection of 2019 novel coronavirus (2019-nCoV) by real-time RT-PCR. Euro Surveillance 2020; 25(3): 2000045.doi: 10.2807/1560-7917. ES.2020.25. 3.2000045.
- Shan F, Gao Y, Wang J, Shi W, Shi N, Han M, et al. Lung infection quantification of COVID-19 patients with deep learning and its application to severity prediction. Med Phys 2020; 10.1002/mp.14609. doi:10.1002/mp.14609.
- Li Y, Xia L. Coronavirus disease 2019 (COVID-19): role of chest CT in diagnosis and management. AJR Am J Roentgenol 2020; 214(6):1280-6. doi:10.2214/AJR.20. 22954.
- Koo HJ, Lim S, Choe J, Choi SH, Sung H, Do KH. Radiographic and CT features of viral pneumonia. Radiographics 2018; 38(3):719-39. doi: org/10.1148/ rg.2018170048.
- Fang Y, Zhang H, Xie J, Lin M, Ying L, Pang P, Ji W. Sensitivity of chest CT for COVID-19: comparison to RT-PCR. Radiology 2020; 296(2):E115-17. doi: org/10.1148/ radiol.2020200432.
- Ai T, Yang Z, Hou H. Correlation of chest CT and RT-PCR testing in coronavirus disease 2019 (COVID-19) in China: A report of 1014 cases. Radiology 2020; 296(2):E32-E40. doi: org/10.1148/radiol.2020200642.
- Zu ZY, Jiang MD, Xu PP, Chen W, Ni QQ, Lu GM, et al. Coronavirus disease 2019 (COVID-19): A perspective from China. Radiology 2020; 296(2):E15-E25. doi: 10.1148/ radiol.2020200490.
- Bernheim A, Mei X, Huang M, Yang Y, Fayad ZA, Zhang N, et al. Chest CT findings in coronavirus disease-19 (COVID-19): Relationship to duration of infection. Radiology 2020; 295(3):200463. doi:10.1148/radiol. 202020 0463.
- Cheng Z, Lu Y, Cao Q, Qin L, Pan Z, Yan F, et al. Clinical features and chest CT manifestations of coronavirus disease 2019 (COVID-19) in a single-center study in Shanghai, China. AJR Am J Roentgnol 2020; 215(1):121-6. doi:10.2214/AJR.20.22959.
- Wang Y, Dong C, Hu Y, Li C, Ren Q, Zhang X, et al. Temporal changes of CT findings in 90 patients with COVID-19 pneumonia: A longitudinal study. Radiology 2020; 296(2): E55-64. doi:10.1148/radiol. 2020200843.
- Yang W, Cao Q, Qin L, Wang X, Cheng Z, Pan A, et al. Clinical characteristics and imaging manifestations of the 2019 novel coronavirus disease (COVID-19): A multi-center study in Wenzhou city, Zhejiang, China. J Infect 2020; 80(4):388-93.doi: 10.1016/j.jinf.2020.02.016.
- Li K, Wu J, Wu F, Guo D, Chen L, Fang Z, et al. The clinical and chest CT features associated with severe and critical COVID-19 pneumonia. Invest Radiol 2020; 55(6):327-31. doi 10.1097/RLI.0000000000000672.
- Pan F, Ye T, Sun P, Gui S, Liang B, Li L, et al. Time course of lung changes on chest CT during recovery from 2019 novel coronavirus (COVID-19) pneumonia. Radiology 2020; 295(3):715-721. Doi:10.1148/radiol.2020200370.
- Bai HX, Hsieh B, Xiong Z, Halsey K, Choi JW, Tran TM, et al. Performance of radiologists in differentiating COVID-19 from viral pneumonia on chest CT. Radiology 2020; 296(2):E46-E54. Doi:10.1148/radiol.2020200823.
- Xiong Y, Sun D, Liu Y, Fan Y, Zhao L, Li X, et al. Clinical and high-resolution CT features of the COVID-19 infection: Comparison of the initial and follow-up changes. Invest Radiol 2020; 55(6):332-339. Doi:10.1097/RLI.000000000 0000674.
- Sohail S. Rational and practical use of imaging in COVID-19 pneumonia. Pak J Med Sci2020; 36(COVID 19-S4):S130-S133. doi: 10.12669/pjms.36.COVID 19-S4. 2760.
- Raza, Sohail & Rasheed, Muhammad & Rashid, Muhammad. (2020). Transmission potential and severity of COVID-19 in Pakistan. Preprints 2020; 2020040004, doi:10.20944/preprints202004.0004.v1.
- Shahzeb M, Khan A, Muhammad A. Role of imaging technology and current status of 2019 Novel Corona virus (COVID -19). Acritical review. Pakistan Heart J 2020; 53(1):5-9. Doi:10.47144/phj.v53il.1894.
- Saseedharan S, Kadam V, Karanam R, Baghel P. CT scan findings of five mildly symptomatic COVID patients from India. J Coll Physicians Surg Pak 2020; 30(6):48-9. doi: 10.29271/jcpsp.2020.Supp 1.S48.
- Asghar MS, Kazmi SJ, Khan NA, Akram M, Khan SA, Rasheed U, et al. Clinical profiles, characteristics, and outcomes of the first 100 admitted COVID-19 patients in Pakistan: A single-centre retrospective study in a tertiary care hospital of Karachi. Cureus 2020; 12(6):e8712. Doi: 10.7759/ cureus. 8712.
- Shahzad N, Abid I, Mirza WJ, Iqbal MM. Rapid assessment of COVID-19 suspected cases: A community based approach for developing countries like Pakistan. J Glob Health 2020; 10(1):010353. Doi:10.7189/jogh.10.010353.
- Song F, Shi N, Shan F, Zhang Z, Shen J, Lu H, et al. Emerging 2019 novel coronavirus (2019-nCoV) pneumonia. Radiology 2020; 295(1):210-7.Doi: 10.1148/radiol.2020 200274.