Computed Tomography Evaluation of Airway Changes in Adult Patients with COVID-19 Pneumonia
By Zhanguo Sun1, Xiaolong Liu1, Jiehuan Wang1, Xiaoqiang Wang1, Wei Liu2, Yueqin Chen1Affiliations
doi: 10.29271/jcpsp.2020.08.785ABSTRACT
Objective: To investigate airway abnormalities on chest CT in adult patients with COVID-19 pneumonia.
Study Design: Observational study.
Place and Duration of Study: Department of Radiology, Affiliated Hospital of Jining Medical University, Jining, Shandong, China, from January to April, 2020.
Methodology: CT scan images were analysed retrospectively. The main CT findings, including pulmonary opacities, airway wall visibility, wall thickening, luminal changes, and the formation of mucus plugs were evaluated. Airway segments were classified into three types based on the spatial relationship between conducting airways and pulmonary opacities.
Results: A total of 275 lesions were detected in 52 patients. Of these, 170 (61.82%) lesions were associated with 243 airway segments, including segments enclosed within lesions (type I, 152, 62.55%), crossing the lesions (type II, 51, 20.99%), and abutting the lesions (type III, 40, 16.46%). The bronchial walls of 154 (63.37%) segments were ill-defined; whereas, the walls of 89 (36.63%) segments were well-defined; in the latter group, 62 (69.66%) showed mild thickening. The bronchial lumen of 183 (75.31%) segments presented mild bronchiectasis and 60 (24.69%) segments appeared normal. Mucus plug was detected in one segment (0.41%). There were no cases of bronchial stenosis, and all bronchial segments located in normal lung regions appeared normal. The appearance of 196 (80.66%) affected bronchi was completely restored before hospital discharge.
Conclusion: Typical airway changes in adult COVID-19 pneumonia include bronchial wall thickening without significant stenosis of the airway lumen and the absence of bronchial mucus plugs. Moreover, bronchi located in unaffected lung regions have a normal appearance. These characteristics have potential value in differential diagnosis.
Key Words: Coronavirus disease, Airway, Computed tomography, Chest.
INTRODUCTION
Since December 2019, coronavirus disease (COVID-19) has rapidly spread across the world and is a significant threat to human health.1 Early diagnosis and patient isolation are essential to effectively manage COVID-19. Reverse-transcription polymerase chain reaction (RT-PCR) is the diagnostic gold standard. However, test results may be negative in COVID-19 patients.2,3 Chest computed tomography (CT) is an effective screening method for COVID-19 because of its high sensitivity. The known CT features of COVID-19 include bilateral and peripheral ground-glass opacities (GGOs).4,5
However, few studies have analysed airway changes in COVID-19 pneumonia on chest CT.6 Examining airway changes and their distribution improves the understanding of the pathology and differential diagnosis of respiratory diseases. Small airways have a diameter of <2–3 mm and are usually undetectable on thin-section CT. Large airways include the trachea and bronchi with a diameter of >2–3 mm and are routinely identified on CT scans.7
The objective of this study was to describe airway changes on CT in adult patients with COVID-19 pneumonia to help combat this epidemic.
METHODOLOGY
This retrospective observational study was approved by the Institutional Review Board and posed no potential risk to patients. It was conducted at Department of Radiology, Affiliated Hospital of Jining Medical University, Jining Shandong, China, from January to April, 2020. The diagnostic criteria for COVID-19 were established by the National Health Commission of the People’s Republic of China.8 The RT-PCR results of throat swabs or sputum of all patients were positive for severe acute respiratory syndrome coronavirus 2 virus (SARS CoV-2).
Chest CT scan was performed using two CT scanners (uCT 760, United Imaging, China; GE Bright Speed, United States). The scanning parameters were as follows: Tube voltage, 120 kVp; tube current, 120–200 mA (with or without automatic tube current modulation); pitch, 1.0875–1.375 mm; slice thickness, 5 mm; reconstructed section interval, 5 mm. Lung window images with slice thickness of 1.25 mm were automatically reconstructed. All CT data were transferred to an image archiving and communication system (Vue PACS, Carestream Health, Inc. Toronto, Canada).
CT scan images were independently reviewed on the Vue PACS workstation by two experienced thoracic radiologists using multiplanar reconstruction tools, and final diagnosis was reached by consensus. All images were reviewed using a fixed lung window (window level, –600 HU; window width, 1600 HU). The analysis focused primarily on the type, number, and distribution of opacities, and airway changes on CT (spatial relationship with opacities, wall visibility, wall thickness, luminal changes, and formation of mucus plugs).
According to the density of the lesions, opacities were classified into ground-glass opacities (GGOs) (dense opacities not obscuring underlying vessels), consolidations (opacities obscuring underlying vessels), and a mixed pattern.6 The distribution was recorded according to the anatomic pulmonary lobe and was classified as peripheral (involving mainly the outer region comprising one-third of the lung) or central (involving mainly the inner region comprising two-thirds of the lung).6 Conducting airways were classified into three types based on their spatial relationship with pulmonary opacities: segments enclosed within lesions (type I), crossing the lesions (type II), or abutting the lesions (type III, Figure 1). Wall thickness and luminal changes were analysed using ipsilateral and contralateral airways as references.
Data were recorded using spreadsheet software (Excel 2010, Microsoft) and analysed using statistical software (SPSS, version 22.0, IBM). Continuous variables with normal distribution were expressed as mean and standard deviation, continuous variables with skewed distribution were expressed as median and interquartile range, and the frequency of clinical characteristics and CT signs were expressed as the number (percentage) of occurrences.
RESULTS
Fifty-two patients (mean age, 39.42 ±10.28 years; range, 20–62 years) were enrolled from January 23, to April 20, 2020 (Table I). All patients were classified as common cases according to the diagnostic criteria (no evidence of severe or critical disease) because they presented mild symptoms and positive imaging findings. All chest CT scans were performed on the day of admission. The median time from the onset of symptoms to the first CT scan was 3.75 days (interquartile range: 3-5 days). The most common clinical symptoms were fever (88.46%) and dry cough (75%). None of the evaluated patients presented copious sputum. The underlying diseases in our cohort included diabetes mellitus (three patients), hypertension (two patients), and chronic obstructive pulmonary disease (COPD, one patient).
Table I: Baseline characteristics of 52 adult patients with COVID-19 pneumonia.
|
Characteristics |
Value (%) |
|
Gender Female Male |
23 (44.23) 29 (55.77) |
|
Clinical symptoms Fever Cough Copious sputum Dyspnea Pharyngalgia Fatigue or muscle soreness Sore throat Dizziness, headache Nausea, vomiting |
46 (88.46) 39 (75.00) 0 2 (3.85) 16 (30.77) 25 (48.08) 6 (11.54) 4 (7.69) 3 (5.77) |
Table II: Computed tomography features (N=275) of 52 adult patients with COVID-19 pneumonia.
|
CT features |
Value (%) |
|
Type of opacity GGO Consolidation Mixed pattern |
178 (64.73) 22 (8.00) 75 (27.27) |
|
Location Left upper lobe Left lower lobe Right upper lobe Right middle lobe Right lower lobe |
35 (12.73) 73 (26.55) 37 (13.45) 41 (14.91) 89 (32.36) |
|
Axial distribution Central Peripheral |
72 (26.18) 203 (73.82) |
|
Airway involvement No Yes |
105 (38.18) 170 (61.82) |
|
GGO = Ground-glass opacity. |
|
The total number of lung lesions in our cohort was 275, including 178 (64.73%) GGOs, 22 (8%) consolidative opacities, and 75 (27.27%) mixed cases (Table II). The lesions were located in the right lung (167, 60.73%), left lung (108, 39.27%), lower lobes (162, 58.91%), upper or middle lobes (113, 41.09%), peripheral area (203, 73.82%), or central area (72, 26.18%).
Of the 275 lesions, 105 (38.18%) did not affect the airways, and the walls and lumen of these airways were unremarkable (Figure 1a).
A total of 170 (61.82%) lesions affected 243 bronchial segments, including subsegmental bronchi (192/243; 79.01%), segmental bronchi (43/243, 17.70%), and lobular bronchi (8/243, 3.29%). Seventy-three lesions affected multiple bronchial segments (Figure 2). The trachea and bilateral main bronchi were not involved. In addition, 152 (62.55%) bronchial segments were type I (affected bronchial segments), 51 (20.99%) were type II, and 40 (16.46%) were type III (Table III).
Table III: Airway changes (N=243) on computed tomography in 52 adult patients with COVID-19 pneumonia.
|
Characteristics |
Value (%) |
|
Distribution pattern Type I (enclosed within) Type II (crossing) Type III (abutting) |
152 (62.55) 51 (20.99) 40 (16.46) |
|
Airway wall Unidentifiable Identifiable Thickened Normal |
154 (63.37) 89 (36.63) 62/89 (69.66) 27/89 (30.34) |
|
Airway lumen Bronchiectasis Stenosis Normal |
183 (75.31) 0 60 (24.69) |
|
Bronchial mucus plug |
1 (0.41) |
|
Air bronchogram |
154 (63.37) |
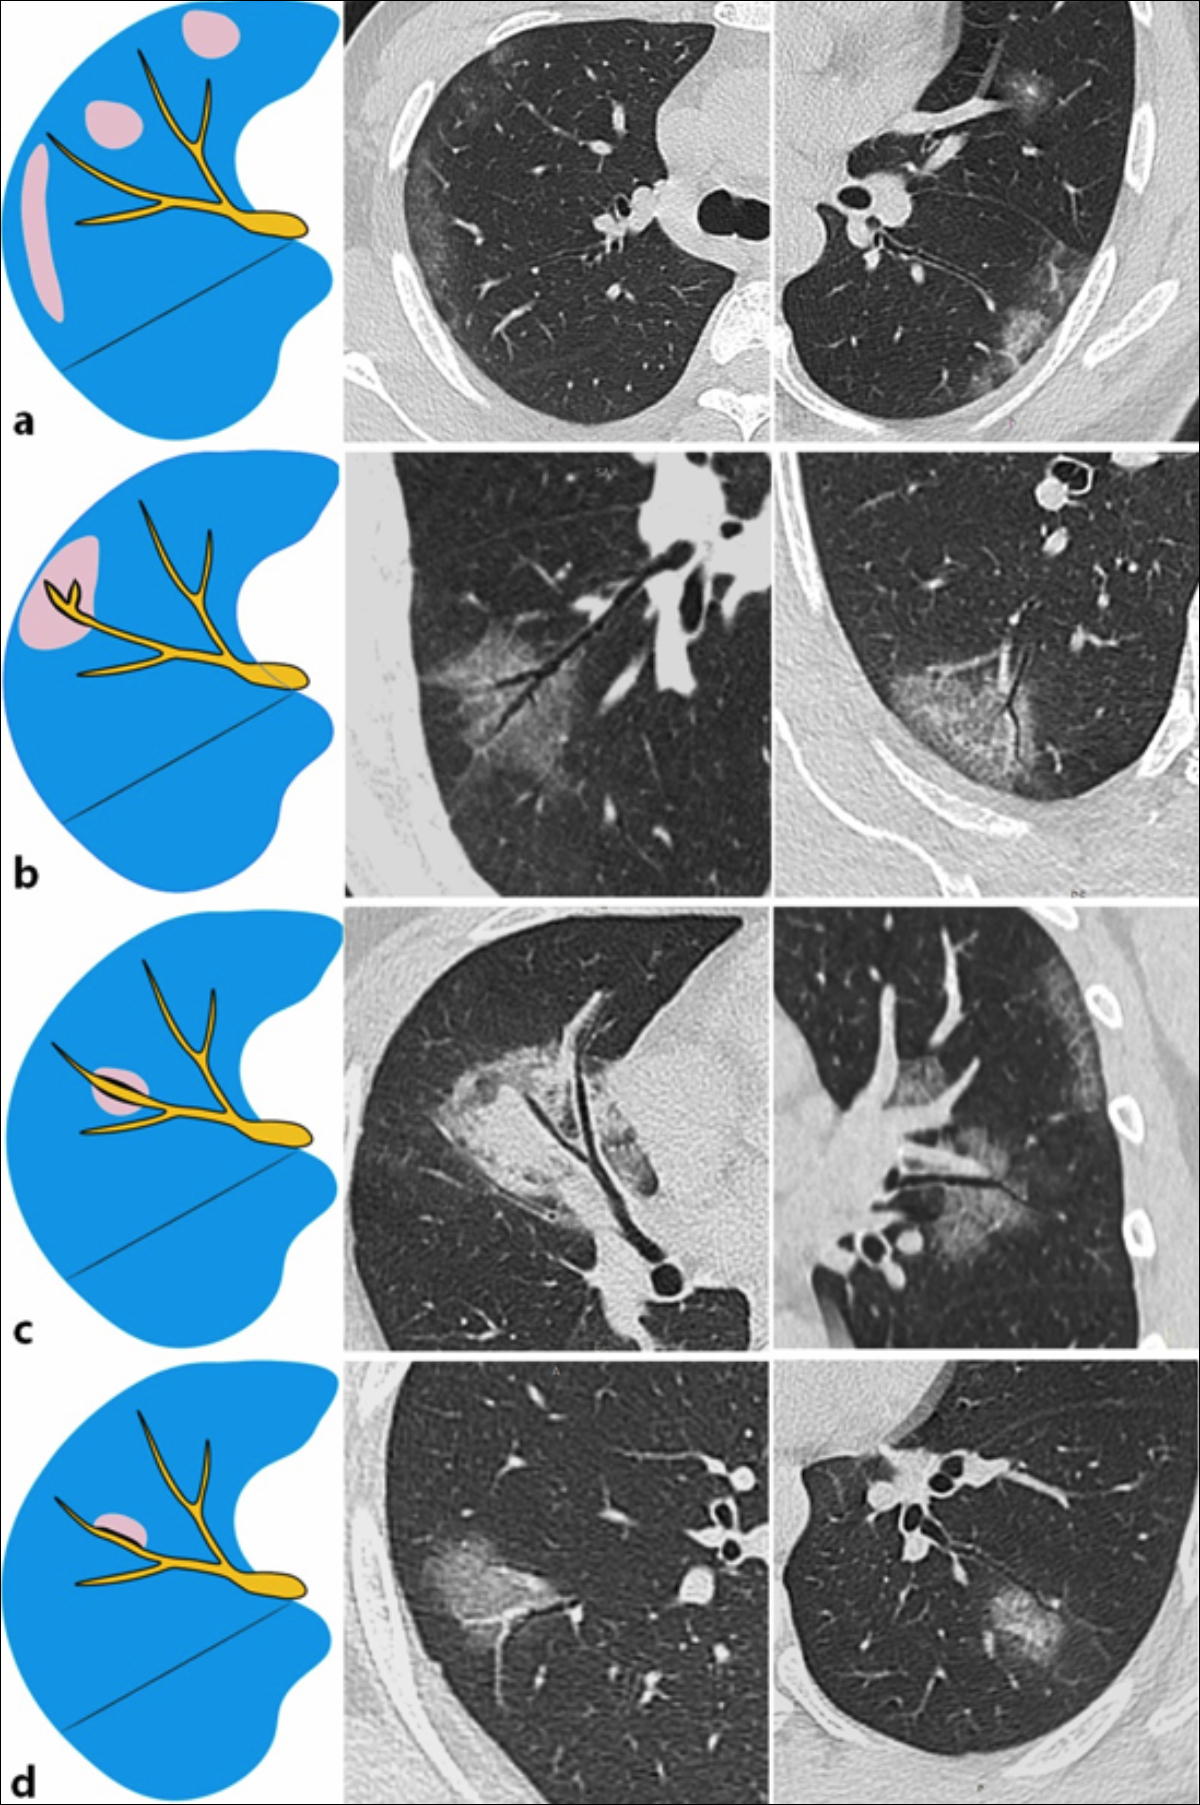 Figure 1: Spatial relationship between conducting airways and pulmonary opacities. (a) Visible airways are not affected. Airway tree with a normal appearance. (b) Airway segment enclosed by the lesion (type I) with mild wall thickening and bronchiectasis. (c) Airway segment crossing the lesion (type II) with mild wall thickening and bronchiectasis. (d) Airway segment abutting the lesion (type III) with wall thickening, mild bronchiectasis, and airway distortion.
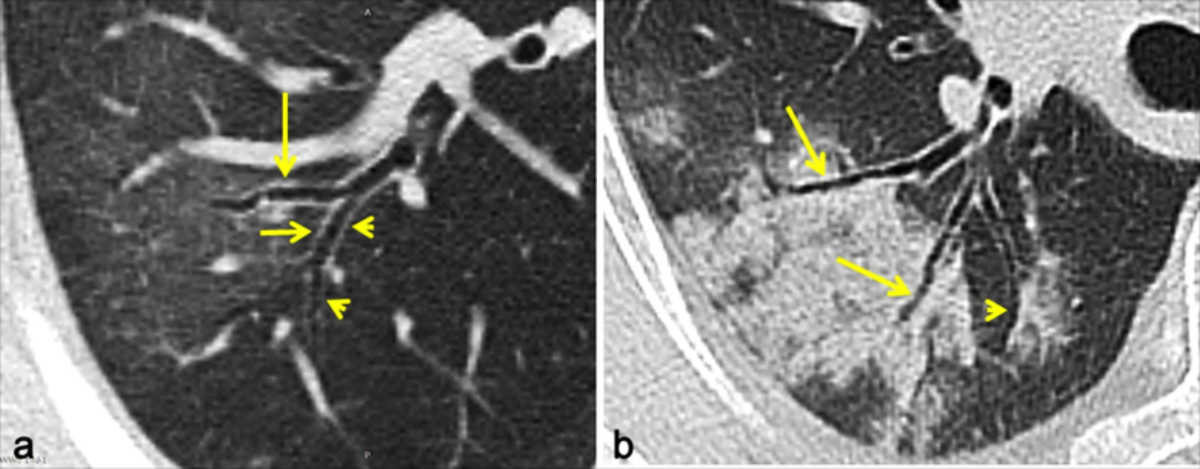 Figure 2: Lung lesions associated with multiple bronchial segments. (a) A bronchial segment (type I) associated with a ground-glass opacity (GGO) has mild bronchiectasis and wall thickening (long arrow); bronchial segments abutted to lung lesions (type III) have mild bronchiectasis and wall thickening (short arrow), whereas the contralateral wall is normal (arrowheads). (b) The bronchial walls crossing a consolidative lesion (type I) are ill-defined, and air bronchograms are present (long arrows). The bronchial walls abutting a consolidative lesion (type III) are ill-defined with mild distortion and bronchiectsis, whereas the contralateral walls are well-defined and without thickening (arrowhead).
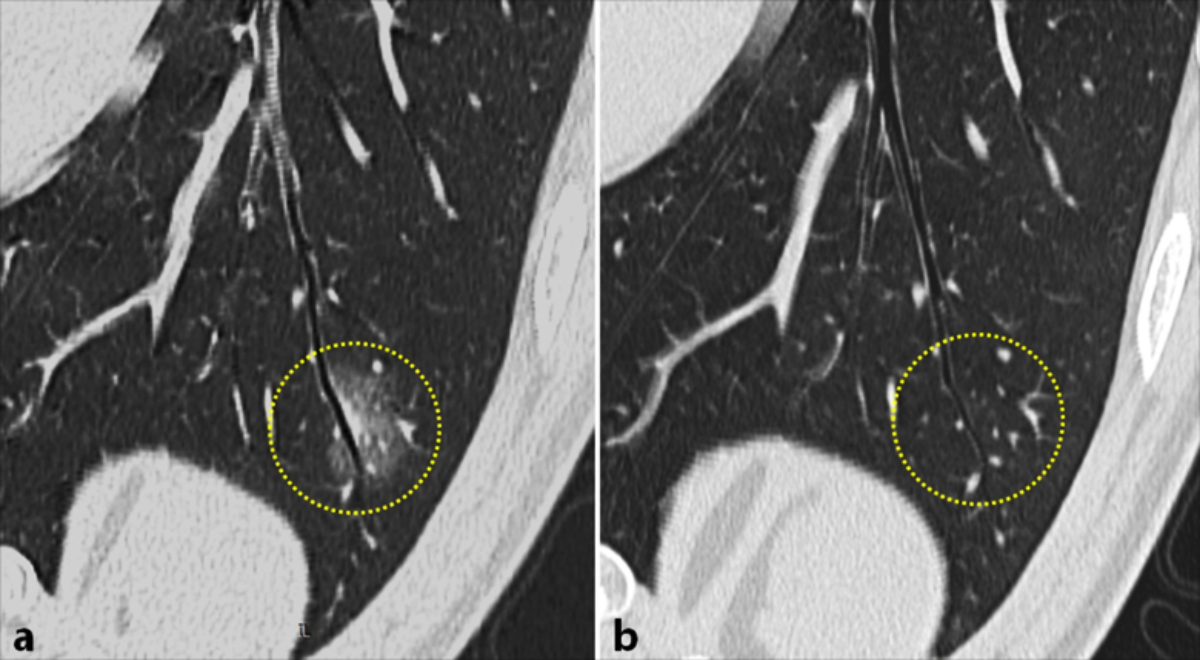 Figure 3: First chest CT scan and last CT scan (19 days later) of a 34-year-old male patient with COVID-19 pneumonia. (a) First CT showing a bronchial segment (type II) crossing a lesion (mixed pattern) with mild wall thickening and bronchiectasis in the left lower lobe. (b) Last CT showing the normal appearance of the bronchial segment after the lesion improved.
Among 243 bronchial segments, the walls of 154 (63.37%) segments were ill-defined because the lesions were hyperintense. The bronchial segments enclosed within and crossing the lesions (types Ⅰ and II) were identified as air bronchogram sign (Figures 1b and c). In segments abutting the lesions (type III), the walls in contact with the lesions were not visible, whereas the contralateral walls were normal, and the margins of these lesions were flattened (Figure 1d).
The walls of 89/243 (36.63%) affected bronchi were well-defined, whereas the walls of 62 segments presented mild thickening. Circumferential wall thickening with a markedly increase in the outer diameter was common in types I and II segments. However, in type III segments, only the walls in contact with the lesions were thickened whereas the contralateral walls were normal. Mucous membranes appeared normal in all segment types; therefore, wall thickening was not due to mucosal edema.
A total of 125/152 (82.24%) type I segments and 38/51 (74.51%) type II segments had mild bronchiectasis with slight bronchial distortion, and 20/40 (50%) type III segments showed moderate bronchial distortion and mild bronchiectasis. Mucus plugs were detected in one type I segment, which was enclosed by a consolidative lesion. No bronchial stenosis was found in bronchi, and bronchi located in normal lung lesions were unremarkable.
Fever and other symptoms improved in all patients after 10–21 days of treatment, and all RT-PCR results were negative in two consecutive samplings. During disease progression, 2–5 follow-up CT examinations were performed in each patient. The results of the last CT examination before discharge were analysed. Of the 275 lesions, 212 (77.09%) improved completely and 63 (22.91%) became fibrotic. In addition, of the 243 affected airway segments, 196 (80.66%) appeared normal, 29 (11.93%) had more severe bronchiectasis and distortion, and 18 (7.41%) showed less bronchiectasis and distortion on the last CT scan (Figure 3).
DISCUSSION
In this study, the most common clinical manifestations of COVID-19 pneumonia were fever and dry cough, as previously reported.9,10 The most frequent CT feature was GGOs with or without consolidative opacities. The distribution of lesions was predominantly bilateral, multilobar, and peripheral. The right lower lobe was the most affected lung area. These characteristics are similar to those of previous studies.11,12 This study is likely to be the first to evaluate the CT features of airway changes and developed a method for classifying the spatial relationship between conducting airways and pulmonary opacities in COVID-19 pneumonia.
The airway changes in COVID-19 pneumonia varied from normal to mild bronchiectasis, bronchial distortion, and air bronchogram sign. Furthermore, most airway abnormalities were restored after opacities improved. These changes in COVID-19 are similar to those found in interstitial infiltrates with diffuse alveolar damage or organizing pneumonia.13 However, in contrast to these changes in COVID-19, bacterial pneumonia, acute bronchitis, Mycoplasma pneumonia, and tuberculosis can induce mucous thickening in large airways and subsequent bronchial stenosis and mucus impaction, and these airway changes may be related to different pathogenic mechan-isms.7,14
SARS-CoV-2 invades the pulmonary interstitium in the early stage, which is characterised by edema and thickening of the interlobular interstitium, subpleural interstitium, interlobular central interstitium, and peribronchovascular interstitium, manifesting as GGOs on chest CT.6 The results showed that, although the walls of most affected bronchi were ill-defined, circumferential wall thickening was observed in the airways of some GGOs. The bronchial mucosa was smooth, and the bronchial lumen showed no stenosis. The observed thickening may be due to pulmonary interstitial edema rather than mucosal edema, which explains the observation that only bronchial walls abutting the lesions were affected. Therefore, airway stenosis is rare in COVID-19.
Spike proteins on the surface of SARS-CoV-2 bind to angiotensin-converting enzyme II (ACE2) receptors. ACE receptors are highly expressed in type II alveolar epithelial cells in the marginal zone and subpleural region in humans.15 Therefore, bronchial epithelial cells are not invaded by SARS-CoV-2 in the early stage, and bronchial segments located in normal lung regions appear normal.
The formation of mucus plugs is common in pulmonary airway diseases, especially acute tracheobronchial infections, and is primarily due to excessive airway secretions and ciliary dysfunction.16 COVID-19 guidelines indicate that part of the bronchial mucosal epithelium is exfoliated and forms a mucous plug.8 In addition, an autopsy of a patient with severe COVID-19 revealed that a large amount of mucinous secretion was expelled from the alveoli of the affected part of the lung, and bronchial mucus was present.17 However, mucus plugs were not observed in our cohort, except in one elderly male patient with a history of COPD. This result may be because most of our patients had mild symptoms, and CT can only detect airways with diameters of >2 mm. The main manifestations of COVID-19 are deep airway and alveolar injury, and the subsequent development of mucus plugs in small airways.17 Moreover, a common clinical symptom in our cohort was dry cough but not sputum, which agrees with previous findings.9 The absence of mucus plugs on chest CT is also consistent with clinical symptoms.
Air bronchogram sign was common in our cohort, and most cases involved mild bronchiectasis, which is consistent with previous studies.18 Air bronchogram sign is formed by air-filled bronchi in hyperdense GGOs or consolidations. There is gradual thickening of inter- and intralobular septa, collapse of normal alveoli, and infiltration of inflammatory cells as disease progresses, potentially leading to GGOs and consolidation.6 In air bronchograms, the walls of large airways are usually ill-defined in consolidative opacities; nonetheless, this CT pattern may indicate the patency of the bronchial lumen without luminal stenosis and mucus plugs.
Previous studies have shown that mild bronchiectasis is a typical finding in COVID-19 pneumonia.6, 18 This condition may involve reduced peribronchial inflammation, residual fibrosis, and bronchial retraction in the opacity and, therefore, is associated with disease progression and airway distortion.6 On the last CT scan, 29 airway segments had severe bronchiectasis and distortion because of the retraction of fibrotic bands.
The present study has some limitations. First, sample size was small, and the cohort included only adult patients with mild symptoms; therefore, the results are not applicable to children and patients with severe disease. Thus, additional studies with larger sample size are needed. Second, CT findings were not confirmed by bronchoscopy and pathology. Third, the authors evaluated scans from the first and last CT examinations but did not analyse dynamic changes during disease progression.
CONCLUSION
Although the diagnosis of COVID-19 is not reliable when based solely on airway changes on CT, these findings are useful to distinguish COVID-19 from other pulmonary infections caused by bacteria, mycoplasma pneumonia, and tuberculosis. Therefore, assessing airway changes is crucial for the diagnosis and differential diagnosis of COVID-19 pneumonia. Furthermore, examining the spatial relationship between large airways and pulmonary opacities helps to elucidate the mechanisms of airway changes in COVID-19.
FUNDING:
This study was supported by the Jining Science and Technology Bureau 2020 Key Research and Development Plan (Scientific Research Fund for COVID-19 Prevention and Control).
ETHICAL APPROVAL:
This study was conducted after approval from the Institutional Review Board.
CONFLICT OF INTEREST:
Authors declared no conflict of interest.
AUTHORS’ CONTRIBUTION:
ZS, XL: Conception and design, acquisition of data, drafting of manuscript.
JW, XW, WL: Conception and design, acquisition of data.
YC: Design of the work, critical revision of the manuscript.
REFERENCES
- Novel Coronavirus (2019-nCoV). World Health Organization. www.who.int/emergencies/diseases/novel-Coronavirus-2019. (Accessed on 5/30/2020).
- Ai T, Yang Z, Hou H, Zhan C, Chen C, Lv W, et al. Correlation of chest CT and RT-PCR testing in coronavirus disease 2019 (COVID-19) in China: A report of 1014 cases. Radiology 2020; 296(2):E32-E40. doi.org/10.1148/radiol.2020200642.
- Fang Y, Zhang H, Xie J, Lin M, Ying L, Pang P, et al. Sensitivity of chest CT for COVID-19: comparison to RT-PCR. Radiology 2020; 296(2):E115-E117.doi: 10.1148/radiol.2020200432.
- Chung M, Bernheim A, Mei X, Zhang N, Huang M, Zeng X, et al. CT imaging features of 2019 Novel Coronavirus (2019-nCoV). Radiology 2020; 295(1):202-7. doi:10.1148/radiol. 2020200230.
- Pan Y, Guan H, Imaging changes in patients with 2019-nCov. Eur Radiol 2020; 30(7):3612-13. doi.org/10.1007/s003 30-020-06713-z.
- Zhou S, Wang Y, Zhu T, Xia L. CT features of Coronavirus Disease 2019 (COVID-19) pneumonia in 62 patients in Wuhan, China. AJR Am J Roentgenol 2020; 214(6):1287-94. https:// doi.org/10.2214/AJR.20.22975.
- Kang EY. Large airway diseases. J Thorac Imaging 2011; 26(4):249-62.doi: 10.1097/RTI.0b013e31822428ef.
- China National Health Commission. Diagnosis and treatment of pneumonitis caused by new coronavirus (trial version 7). Beijing: China National Health Commission. 2020.
- Chen Z, Fan H, Cai J, Li Y, Wu B, Hou Y, et al. High-resolution computed tomography manifestations of COVID-19 infections in patients of different ages. Eur J Radiol 2020; 126:108972. doi: 10.1016/j.ejrad.2020.108972.
- Xu YH, Dong JH, An WM, Lv XY, Yin XP, Zhang JZ, et al. Clinical and computed tomographic imaging features of novel coronavirus pneumonia caused by SARS-CoV-2. J Infect 2020; 80(4):394-400. doi: 10.1016/j.jinf.2020.02.017.
- Shi H, Han X, Jiang N, Cao Y, Alwalid O, Gu J, et al. Radiological findings from 81 patients with COVID-19 pneumonia in Wuhan, China: A descriptive study. Lancet Infect Dis 2020; 20(4):425-34. doi: 10.1016/S1473-3099(20)30086-4.
- Salehi S, Abedi A, Balakrishnan S, Gholamrezanezhad A. Coronavirus Disease 2019 (COVID-19): A systematic review of imaging findings in 919 patients. AJR Am J Roentgenol 2020; 215(1):87-93. doi: 10.2214/AJR.20.23034.
- Koo HJ, Lim S, Choe J, Choi SH, Sung H, Do KH. Radiographic and CT features of viral pneumonia. Radiographics 2020; 38(3):719-39. doi: 10.1148/rg.2018170048.
- Tanaka H. Correlation between radiological and pathological findings in patients with Mycoplasma pneumoniae pneumonia. Front Microbiol 2016; 7:695. doi: 10.3389/fmicb.2016.00695.
- Wang J, Liu J, Wang Y, Liu W, Chen X, Sun C, et al. Dynamic changes of chest CT imaging in patients with corona virus disease-19. Zhejiang Da Xue Xue Bao Yi Xue Ban 2020; 49(1):0. doi.org/10.3785/j.issn.1008-9292.2020.02.03.
- Xu Q, Zhang L, Hao C, Jiang W, Tao H, Sun H, et al. Prediction of bronchial mucus plugs formation in patients with refractory mycoplasma pneumoniae pneumonia. J Trop Pediatr 2016; 63(2):148-54. doi: 10.1093/tropej/fmw064.
- Liu Q, Wang RS, Qu GQ, Wang YY, Liu P, Zhu YZ, et al. Gross examination report of a COVID-19 death autopsy. Fa Yi Xue Za Zhi 2020; 36(1):21-3. doi: 10.12116/j.issn.1004-5619. 2020.01.005.
- Li Y, Xia L. Coronavirus Disease 2019 (COVID-19): Role of chest CT in diagnosis and management. AJR Am J Roentgenol 2020; 214(6):1280-6.doi: 10.2214/AJR.20.22954.