Association of Hypertension with Non-HDL Cholesterol in Patients with Type 2 Diabetes Mellitus
By Neelum Zaka1, Naheed Gul1, Nadia Ishfaq1, Lubna Meraj2, Mehwish Rafique3Affiliations
doi: 10.29271/jcpsp.2020.08.822ABSTRACT
Objective: To determine the association of hypertension with Non-HDL Cholesterol (Non-HDL.C) among patients with type 2 diabetes mellitus.
Study Design: Descriptive study.
Place and Duration of Study: Shifa Foundation Community Health Centre, Shifa International Hospital, Islamabad, from January to December 2019.
Methodology: This study comprised of 214 patients with type 2 diabetes. Detailed history, examination, anthropometric measurements, fasting lipid profiles and blood glucose levels were recorded for all patients. Non-HDL.C was determined in all patients by subtracting HDL Cholesterol (HDL.C) from total Cholesterol (Total.C). Association of hypertension with Non-HDL.C was analysed using Chi-square Fisher Exact test for qualitative data and post-stratification t-test for quantitative data. Correlation of rising levels of Non-HDL.C with Total.C, LDL.C, Triglycerides, HDL.C and fasting blood sugar was analysed using ANOVA. SPSS version 23 was used for statistical analysis.
Results: Non-HDL.C was raised in 169 (78.97%) patients with type 2 diabetes. However, there was no significant difference in the mean Non-HDL.C among patients with hypertension and without hypertension (156.35 +38.52 mg/dl versus 156.81 +45.82 mg/dl; p = 0.936). Furthermore, there was no significant difference in the Total.C, LDL.C, Triglycerides and the number of patients with raised Non-HDL.C among both groups. Increasing values of Non-HDL.C correlated significantly to Total.C, LDL.C and Triglycerides (p <0.001).
Conclusion: Hypertension had no significant association with Non-HDL.C in patients with type 2 diabetes. However, the raised level of Non-HDL.C in majority of type 2 diabetic patients in addition to significant correlation with Total.C, LDL.C and Triglycerides necessitates its screening irrespective of the blood pressure status.
Key Words: Non-HDL cholesterol, Dyslipidemia, Diabetes, Hypertension.
INTRODUCTION
Dyslipidemia is described as raised levels of Total.C, LDL.C or decreased level of HDL.C. Being an established risk factor for coronary artery disease, both in diabetic and non-diabetic patients, early diagnosis and treatment of dyslipidemia can lower the risk of coronary artery disease.1 Among all types of lipids, currently LDL.C is the main focus of lipid lowering therapy, for primary and secondary prevention of cardiovascular diseases.2,3
Somehow, it has been observed that despite controlling LDL.C levels, patients develop recurrent coronary artery diseases.4 Some recent studies suggest that as compared to LDL.C, Non-HDL.C turns out to be a surpassing predictor for cardiovascular illnesses.5
Non-HDL.C is determined in patients by taking off HDL.C from Total.C. Its value portrays a complete picture of cholesterol which leads to atherosclerosis, namely intermediate density lipoprotein, Lipoprotein A, very low-density lipoprotein and its remnant.6,7 Besides, National Cholesterol Education Program-me suggests adopting Non-HDL.C in evaluating cardiovascular disease risk especially in diabetic patients in addition to other lipid parameters.8
Alongside dyslipidemia, hypertension is also seen as a component of metabolic syndrome in diabetic patients.9 Hypertension being asymptomatic in most patients remains undetected and leads to end organ damage by increasing atherosclerosis.
Table I: Baseline characteristics of patients.
|
Parameters |
Normotensive (n=104) |
Hypertensive (n=110) |
p-value |
|
|
Age |
47.93 ± 8.99 |
50.99 ± 9.02 |
0.014 |
|
|
Gender |
Male Female |
39 (37.5%) 65 (62.5%) |
18 (16.4%) 92 (83.6%) |
<0.001
|
|
Marital status |
Married Unmarried |
104 (100%) 0 |
110 (100%) 0 |
- |
|
Education |
Educated Uneducated |
60 (57.7%) 44 (42.3%) |
65 (59, 1%) 45 (40.9%) |
0.836 |
|
Occupation |
Employed Unemployed |
45 (43.3%) 59 (56.7%) |
17 (15.5%) 93 (84.5%) |
<0.001
|
|
Smoking history |
Yes No |
7 (6.7%) 97 (93.3%) |
7 (6.4%) 103 (93.6%) |
0.914
|
|
Duration of diabetes |
<5 years 5-10 years >10 years |
59 (56.7%) 28 (26.9%) 17 (16.3%) |
56 (50.9%) 34 (30.9%) 20 (18.2%) |
0.693
|
|
Body mass index |
Normal Overweight Obese |
30 (28.8%) 30 (28.8%) 44 (42.3%) |
12 (10.9%) 32 (29.1%) 66 (60%) |
0.002
|
|
Blood pressure |
Controlled Uncontrolled |
104 (100%) 0 |
92 (83.6%) 18 (16.4%) |
<0.001 |
|
Non-HDL cholesterol |
<130 130-160 >160 |
24 (23.1%) 32 (30.8%) 48 (46.2%) |
21 (19.1%) 38 (34.5%) 51 (46.4%) |
0.727
|
Table II: Biochemical parameters among normotensive and hypertensive groups.
|
Parameters (mg/dl) |
Normotensive (n=104) |
Hypertensive (n=110) |
p-value |
|
Non-HDL cholesterol |
156.81 ± 45.82 |
156.34 ± 38.52 |
0.936 |
|
BSF (blood glucose fasting) |
191.10 ± 83.17 |
157.18 ± 53.42 |
<0.001 |
|
TC (total cholesterol) |
194.26 ± 47.44 |
192.44 ± 41.52 |
0.765 |
|
LDL cholesterol |
121.73 ± 41.07 |
123.76 ± 37.68 |
0.706 |
|
TG (triglycerides) |
215.32 ± 148.19 |
190.11 ± 102.63 |
0.148 |
|
HDL cholesterol |
37.03 ± 7.40 |
42.37 ± 21.127 |
0.015 |
Table III: The biochemical parameters at different levels of non-HDL cholesterol.
|
Parameters |
Non-HDL cholesterol (Normotensive group n=104) |
p-value |
||
|
<130 mg/dL (n=24) |
130-160 mg/dL (n=32) |
>160 mg/dL (n=48) |
||
|
BSF |
217.38 ± 96.58 |
188.75 ± 65.89 |
179.52 + 85.08 |
0.188 |
|
TC |
142.42 ± 30.49 |
184.97 ± 35.43 |
226.38 ± 34.13 |
<0.001 |
|
LDL |
84.08 ± 26.61 |
112.13 ± 33.77 |
146.96 ± 34.08 |
<0.001 |
|
TG |
155.25 ± 133.35 |
185.69 ± 44.55 |
265.10 ± 182.06 |
0.004 |
|
HDL |
34.04 ± 6.89 |
38.03 ± 7.21 |
37.85 ± 7.52 |
0.077 |
|
|
Non-HDL cholesterol (Hypertensive group n=110) |
|
||
|
<130 mg/dL (n=21) |
130-160 mg/dL (n=38) |
>160 mg/dL (n=51) |
p-value |
|
|
BSF |
155.62 ± 40.650 |
167.11 ± 70.42 |
150.43 ± 42.05 |
0.346 |
|
TC |
146.95 ± 17.735 |
186.26 ± 35.47 |
215.76 ± 35.33 |
<0.001 |
|
LDL |
89.38 ± 24.758 |
125.29 ± 38.11 |
136.78 ± 33.23 |
<0.001 |
|
TG |
149.24 ± 58.599 |
184.16 ± 127.62 |
211.37 ± 91.37 |
0.058 |
|
HDL |
37.67 ± 7.052 |
48.24 ± 33.85 |
39.94 ± 7.98 |
0.097 |
High blood pressure further accentuates the risk of microvascular and macrovascular complications of diabetes and increases mortality in patients with diabetes by 7.2 times. Thus, in order to minimise occurrence of cardiovascular diseases in diabetics, it is not only important to control blood sugar levels but also hypertension and hyperlipidemia.10
Previous work has emphasised the role of Non-HDL.C in diabetes.11 However, the association of hypertension with Non-HDL.C in patients with type 2 diabetes is not well established in Pakistan. Only one local study has determined the effect of hypertension on hyperlipidemia in diabetes but it did not include Non-HDL.C.12 This study will help in identifying type 2 diabetic patients requiring intensified lipid lowering therapy, once the LDL.C targets have been achieved. It will also provide a baseline for future research into the impact of other risk factors on Non-HDL.C among patients with type 2 diabetes in Pakistan.
The purpose of this study was to determine the association of hypertension with Non-HDL.C among type 2 diabetic patients, and the association of rising level of Non-HDL.C with other lipid parameters (Total.C, LDL.C, Triglycerides and HDL.C) and fasting blood sugar.
METHODOLOGY
This descriptive (prospective, observational) study was conducted at Department of Medicine, Shifa Community Health Centre, affiliated with Shifa International Hospital, Shifa Tameer-e-Millat University, Islamabad from January to December 2019. This study comprised of 214 patients with type 2 diabetes. Sample size was calculated as 196 with WHO sample size calculator using the following parameters: anticipated patient population 0.52, confidence interval 95%, absolute precision 0.07.11 However, sample size was increased up to 214 to make up for contingencies. Both male and female patients with type 2 diabetes were included in the study. Patients with hypothyroidism, chronic kidney disease, liver disease and pregnancy were excluded.
Institutional Review Board approval was obtained before starting data collection. Patients were included after taking written informed consent. Non-probability convenience sampling technique was used for patients selection. Data collection procedure included detailed patient’s history, clinical examination including blood pressure readings, height and weight. This was followed by collection of blood samples after an overnight fast for fasting lipid profile and fasting blood sugar levels in all patients.
National Cholesterol Education Programme rules were referred to define dyslipidemia. Total.C, LDL.C, Triglycerides and Non-HDL.C less than 200 mg/dl, 100 mg/dl, 150 mg/dl and 130 mg/dl respectively and HDL.C more than 40 mg/dl were considered as normal. Non-HDL.C was calculated by subtracting HDL.C from Total.C. High blood pressure was defined as blood pressure more than 140/90 mmHg. Normal fasting blood sugar was defined as less than 100 mg/dl. Normal BMI was defined as 18.5 to 24.9 Kgs/m2, overweight as 25-29.9 Kgs/m2and obesity as more than 30 Kgs/m2.
Data was analysed using SPSS version 23. Qualitative variables were described using frequency and percentages whereas quantitative variables were described using mean and standard deviation. Chi-square, Fisher-Exact test was used to see association of hypertension with Non-HDL.C in patients with type 2 diabetes. Post-stratification t-test was used to see difference in the quantitative variables and Chi-square, Fisher-Exact test was used to see difference in the qualitative variables among patients with hypertension (n=110) and patients without hypertension (n=104). ANOVA test was used to see association of rising levels of Non-HDL.C values with Total.C, LDL.C, triglycerides, HDL.C and fasting blood sugar. The p-value <0.05 was considered as statistically significant.
RESULTS
Two hundred and fourteen patients with type 2 diabetes including 110 patients with hypertension and 104 patients with normal blood pressure, respectively were analysed for Non-HDL.C. Baseline characteristics of patients analyzed for Non-HDL.C are given in Table I. Normotensive patients had a mean age of 47.93 +8.99 years while hypertensive patients had a little higher mean age of 50.99 +9.02 years. Female gender, unemployment, uncontrolled blood pressure and obesity were more common in hypertensive type 2 diabetic patients. However, both the groups did not differ with respect to education, marital status, history of smoking and duration of diabetes (p >0.05).
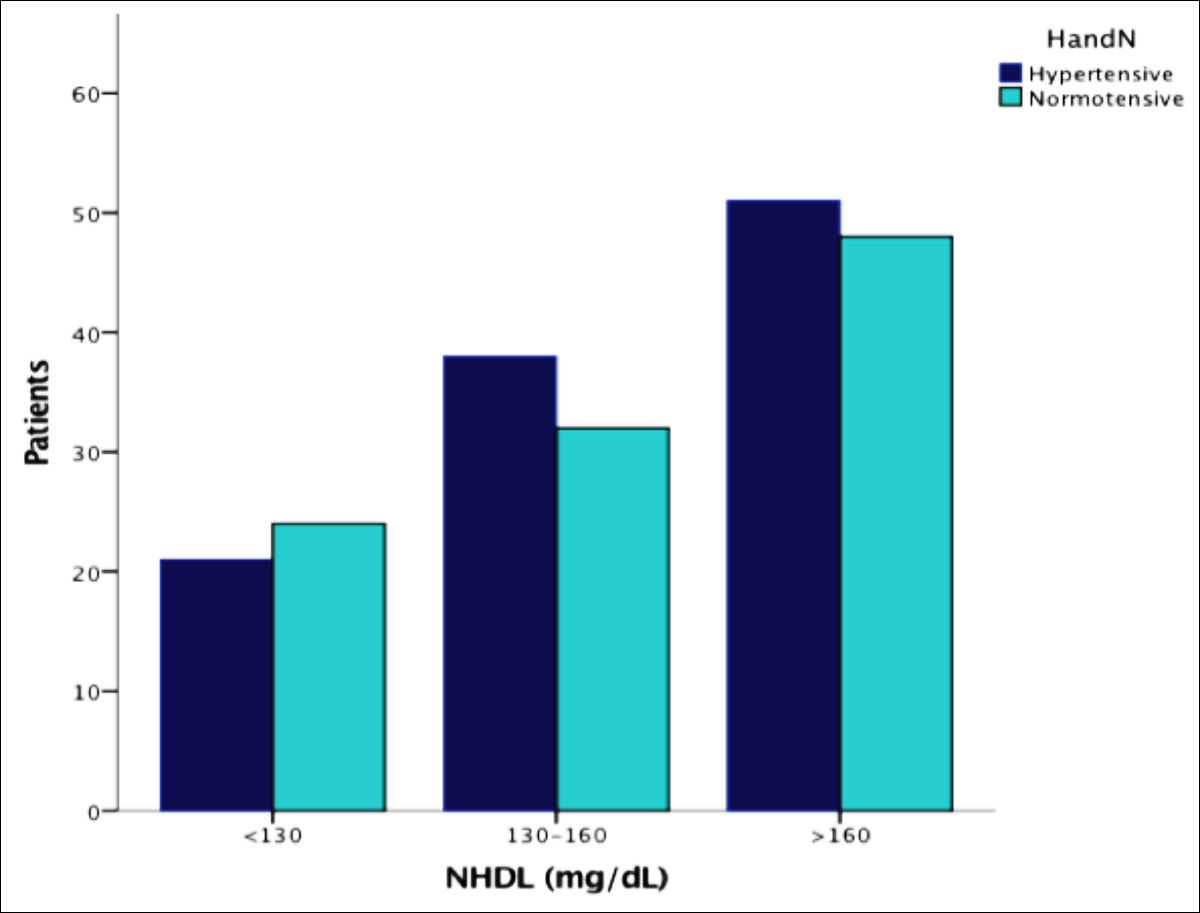 Figure 1: Non-HDLC levels in hypertensive and normotensive diabetics.
Overall, Non-HDL.C was raised (>130 mg/dl) in 169 (78.97%) and normal (<130 mg/dl) in 45 (21.03%) patients (Figure 1). However, the number of hypertensive patients with raised Non-HDL.C (>130 mg/dl) did not differ significantly from normotensive patients (Table I). Furthermore, there was no significant difference in the mean Non-HDL.C among patients with hypertension compared to those without hypertension (156.35 +38.52 mg/dl vs. 156.81 +45.82 mg/dl; p >0.05). This shows that there was no significant association of Non-HDL.C with hypertension in patients with type 2 diabetes.
In addition to Non-HDL.C, the hypertensive patients were analyzed for its association with Total.C, LDL.C, Non-HDL.C, HDL.C, Triglycerides and fasting blood sugar. The difference in the biochemical parameters between the hypertensive and normotensive patients is given in Table II. There was no significant difference with respect to the Total.C, LDL.C, Non-HDL.C and Triglycerides among hypertensive patients and patients with normal blood pressures. However, the mean fasting blood glucose was high (191.10 +83.17) in the normotensive patients as compared to 157.18 +53.42 in the hypertensive patients, which was statistically significant (p = <0.001). On the other hand, HDL.C was lower in normotensive compared to hypertensive patients (p = 0.015).
The association of increasing level of BMI with Non-HDL.C was also studied in hypertensive type 2 diabetic patients. Obesity was more prevalent in hypertensive patients. Ninety-eight (89.1%) hypertensive patients were either overweight or obese compared to 74 (71.1%) normotensive patients (p = 0.002). However, there was no statistically significant association of increasing level of BMI (normal, overweight and obese) with Non-HDL.C levels in the hypertensive patients (p = 0.199). Similar findings were observed in the normotensive patients, showing no association of increasing BMI with Non-HDL.C (p = 0.492).
The association of rising level of Non-HDL.C with Total.C, LDL.C, HDL.C, Triglycerides and fasting blood sugars was further explored. The variance amid the three categories based on increasing levels of Non-HDL.C is detailed in Table III. Category 1 was defined as Non-HDL.C <130 mg/dl, Category 2 as Non-HDL.C of 130-160 mg/dl and Category 3 as Non-HDL.C >160 mg/dl, respectively. It was observed that increasing levels of Non-HDL cholesterol was also associated with derangement of other lipid parameters among both groups. However, this difference was statistically significant for Total.C, LDL.C and Triglycerides (p <0.05). HDL.C and fasting blood sugar were not explicitly affected with rising level of Non-HDL.C.
DISCUSSION
Traditionally, atherogenic dyslipidemia is described as uplifted values of Triglycerides and LDL.C and lowered values of high-density lipoprotein (HDL.C).13 Amongst diabetic dyslipidemia, Non-HDL.C have been recently identified as an important predictor of cardiovascular diseases, especially amongst subjects having diabetes.14 Nevertheless, the effect of different parameters like hypertension, obesity and glycemic control on Non-HDL.C need to be explored. The association of hypertension with Non-HDL.C was studied because the collation of deranged lipids and cardiovascular disease is more in patients who have diabetes and hypertension.15 It was observed, that the Non-HDL.C was higher in the hypertensive as compared to normotensive patients. However, this difference amid the two groups was not convincingly significant (p >0.05). This suggests that hypertension was not associated with Non-HDL.C in patients with type 2 diabetes. One of the reasons for this finding could be the fact that fasting blood sugars were lower in the hypertensive patients compared to the normotensive patients.
In the study, 80 (76.92%) normotensive patients had Non-HDL.C above normal (130 mg/dl) and among these majority had Non-HDL.C above 160 mg/dl. In the hypertensive group as well, 89 (80.9%) patients had Non-HDL.C above 130 mg/dl and majority had Non-HDL.C above 160 mg/dl, despite having HDL.C in the normal range. The uncontrolled sugars as shown by high levels of fasting blood sugars could have been contributing to these high levels of Non-HDL.C in these patients. This shows that diabetic patients are prone to have high Non-HDL.C regardless of the presence or absence of hypertension. Studies have emphasised that among this high-risk group, lipid goal must be attained in timely manner.10,16
In addition to Non-HDL.C, we also studied Total.C, LDL.C, triglycerides, HDL.C which were deranged similar to previous studies.17,18 However, the presence of hypertension in patients with type 2 Diabetes had no significant effect on these parameters except HDL.C in the studied population. These results coincide with a previous study, which reported no effect of hypertension on lipid levels in patients with diabetes, however it did not study Non-HDL.C.12 On the other hand, these results differ from a study done in Saudi Arabia, which showed the lipid levels to rise with increasing levels of systolic and diastolic blood pressures in diabetic patients.19
It was observed that increasing levels of Non-HDL cholesterol were also associated with abnormal levels of Total.C, LDL.C and triglycerides in both hypertensive and normotensive patients, thus increasing the atherogenic risk. Because LDL.C was closely associated with rising level of Non-HDL.C in our study, Non-HDL.C proved itself significant for predicting cardiovascular risk in future. NonHDL.C represented better prognosticator of vascular problems in one study.20 In most patients in whom target LDL is achieved, Non-HDL.C control is still poor.21 Hence, screening for high Non-HDL.C in patients with type 2 diabetes can be a cost-effective strategy.
Obesity was very common in our study population, more so in the hypertensive patients. However, rising level of BMI was not associated with increasing level of Non-HDL cholesterol in both normotensive and hypertensive diabetic patients. This makes diabetes an independent risk factor for hyperlipidemia in this study group as opposed to another study’s results where the BMI was observed to be associated with Non-HDL.C.22 These results highlighted the association of hypertension with Non-HDL.C in patients with type 2 diabetes. This will provide a baseline for future research into the impact of other risk factors on Non-HDL.C in such patients. It will also make the health professionals aware of the importance of Non-HDL.C as it is not reported by laboratory in routine lipid profile.
This was small size, hospital-based study. Hence, the generalisation of these results require large scale studies to better elucidate the association of hypertension with Non-HDL.C in patients with diabetes.
CONCLUSION
Hypertension was not associated with Non-HDL.C in patients with type 2 diabetes. However, the high prevalence of raised Non-HDL.C levels in Pakistani patients with type 2 diabetes necessitates that it should be reported in routine lipid profile panel. Non-HDL.C correlated significantly with atherogenic lipids including Total.C, LDL.C and Triglycerides, proving itself to be major lipid parameter in predicting cardiovascular risk among patients with type 2 diabetes in Pakistan.
ETHICAL APPROVAL:
Institutional Review Board of Shifa International Hospital Limited and Shifa Tameer-e-Millat University granted approval for data collection. (Ref.: IRB # 049-2011).
PATIENTS’ CONSENT:
Written informed consents were taken from all the patients.
CONFLICT OF INTEREST:
The authors declared no conflict of interest.
AUTHORS’ CONTRIBUTION:
NZ: Conception, study design, data collection.
NG: Study design, data collection, write-up.
NI: Data collection, literature review.
LM: Literature review, write-up.
MR: Statistical analysis and compilation of research.
REFERENCES
- Krishna NC. The study of Non-HDL cholesterol levels compared to LDL Cholesterol levels in Diabetics. J Med Sci ClinRes 2017; 5(3):18716-23.
- Downs JR, Clearfield M, Weis S, Whitney E, Shapiro DR, Beere PA, et al. Primary prevention of acute coronary events with lovastatin in men and women with average cholesterol levels: Results of AFCAPS/TexCAPS. Air force /Texas Coronary Atherosclerosis Prevention Study. JAMA 1998; 279(20):1615-22. doi: 10.1001/jama.279.20.1615.
- Heart Protection Study Collaborative Group. MRC/BHF Heart Protection Study of cholesterol lowering with simvastatin in 20,536 high risk individuals: A randomised placebo-controlled trial. Lancet 2002; 360(9326):7-22. doi: 10.1016/ S0140-6736(02)09327-3.
- Cannon CP, Braunwald E, McCabe CH, Rader DJ, Rouleau JL, Belder R, et al. Intensive versus moderate lipid lowering with statins after acute coronary syndrome. N Engl J Med 2004; 350(15):1495-504. doi: 10.1056/NEJMoa040583.
- Virani SS. Non-HDL cholesterol as a metric of good quality of care: Opportunities and Challenges. Tex Heart Inst J 2011; 38(2):160-2.
- Grundy MD, Scott M. Hypertriglyceridemia, atherogenic dyslipidemia, and metabolic syndrome. Am J Cardiol 1998; 81(4A): 18-25. doi:10.1016/s0002-9149(98)00033-2.
- Grundy SM. Low density lipoprotein, non-high-density lipoprotein, and apolipoprotein B as targets of lipid lowering therapy. Circulation 2002; 106(20):2526-9. doi: 10.1161/ 01.cir.0000038419.53000.d6.
- Lu W, Resnick HE, Jablonski KA, Jones KL, Jain AK, Howard WJ, et al. Non-HDL cholesterol as a predictor of cardiovascular disease in type 2 Diabetes: The strong heart study. Diabetes Care 2003; 26(1):16-23. doi: 10.2337/ diacare. 26.1.16.
- American Diabetes Association. Cardiovascular disease and risk management. Diabetes care 2016; 40:S75-87.
- Bakris GL, Sowers JR. American society of hypertension writing group. ASH position paper: Treatment of hypertension in patients with diabetes- an update. J Clin Hyper 2008; 10(9):707-13. doi: 10.1111/j.1751-7176. 2008.00012.x.
- Ram N, Hashmi F, Jabbar A, Ahmed B. Importance of measuring Non-HDL cholesterol in type 2 diabetes Patients. J Pak Med Assoc 2014; 64(2):124-8.
- Arshad AR, Tipu HN, Paracha AI. The impact of hyper-tension on lipid parameters in type 2 diabetes. J Pak Med Assoc 2016; 66(10):1262-66.
- Madhu K, Manjunath C, Rawal J, Irani P. Atherogenic dyslipidemia. Indian J Endocrinol Metab 2013; 17(6): 969-76. doi: 10.4103/2230-8210.122600.
- Fruchart JC, Sacks F, Hermans MP, Assasman G, Brown WV, Ceska R, et al. The residual risk reduction initiative: A call to action to reduce residual vascular risk in patients with dyslipidemia. Am J Cardiol 2008; 102(10 suppl):1K-34K. doi: 10.1016/S0002-9149(08)01833-X.
- Assman G, Schulte H. The prospective cardiovascular Munster (PROCAM) study: Prevalence of hyperlipidemia in persons with hypertension and/or diabetes mellitus and relationship to coronary heart disease. Am Heart J 1988; 116(6):1713-24. doi.org/10.1016/0002-8703(88)90220-7.
- Grundy SM, Cleerman JI, Merz CN, Brewer Jr HB, Clark LT, Hunninghake DB, et al. Implications of recent clinical trials for the National Cholesterol Education Programme Adult Treatment Panel III guidelines. Circulation 2004; 110(2):227-39. doi: 10.1161/01.CIR.00001 33317.497 96.0E.
- Wei M, Mitchell BD, Haffner SM, Stern MP. Effects of cigarette smoking, diabetes, high cholesterol, and hypertension on all cause mortality and cardiovascular disease mortality in Mexican Americans. The San Antonio Heart Study. Am J Epidemiol 1996; 144(11): 1058-65. doi: 10.1093/oxfordjournals.aje.a008878.
- Habib SS. Frequency distribution of atherogenic dyslipidemia in Saudi type 2 Diabetic patients. Pak J Physiol 2006; 2(2):20-3.
- Aziz KMA. Association of serum lipids with high blood pressure and hypertension among diabetic patients. Mathematical regression models to predict blood pressure from lipids. An experience from 12-year follow up of more than 9000 patients' cohort. Gen Med 2017; 5:297.
- Di Angelantonio E, Sarwar N, Perry P, Kaptoge S, Ray KK, Thompson A, et al. Major lipids, apolipoproteins, and the risk of vascular disease. JAMA 2009; 302(18):1993-2000. doi:10.1001/jama.2009.1619
- Vulic D, Lee BT, Dede J, Lopez VA. Extent of control of cardiovascular risk factors and adherence to recommended therapies in US multiethnic adults with coronary heart disease: From 2005-2006 national survey. Am J Cardiovasc Drugs 2010; 10(2):109-14. 10.2165/11535240- 000000 000-00000.
- Pirro G, Del Giorno R, Lupatelli G, Mannarino MR, Roscini AR, Covelli D, et al. Cardiovascular risk factors and recommended lipid goals attainment among patients referred in a tertiary care lipid clinic. Eur J Intern Med 2011; 22(4):412-7. doi: 10.1016/j.ejim.2011.04.007.