Apparent Diffusion Coefficient in Predicting the Preoperative Grade of Meningiomas
By Basak Atalay1, Suna Sahin Ediz2, Nurver Ozel Ozbay3Affiliations
doi: 10.29271/jcpsp.2020.11.1126ABSTRACT
Objective: To investigate the relationship between the apparent diffusion coefficients (ADC) value obtained from magnetic resonance imaging (MRI) and histopathologic grade of meningiomas.
Study Design: Observational study.
Place and Duration of Study: Department of Radiology, Istanbul Medeniyet University, School of Medicine, Istanbul, Turkey between January 2015 and June 2019.
Methodology: Data of 45 patients with meningiomas, who underwent surgery at the University Hospital, were retrospectively reviewed; 28 patients were enrolled in the study. The pathology preparations of the patients were re-evaluated according to the World Health Organisation (WHO) 2016 classification updated by a neuropathologist. ADC values were measured in a standard region of interest range from the three consecutive sections where the mass had the largest width and from the opposite white matter.
Results: Fourteen patients (50%) were diagnosed with WHO grade I tumor, 11 with grade II (39.3%), and three with grade III (10.7%). The ADCmin value was found statistically significant for the differentiation of tumor grades (p = 0.018). The cut-off point of the ADCmin value was 0.634x10⁻³mm2s for the differential diagnosis of grade I and grade II/III meningiomas. The sensitivity of the cut-off value was found as 86% and its specificity as 57%. The patients with increased cellularity and Ki67 proliferation index had statistically significantly lower ADCmin values (p = 0.025).
Conclusion: The data of this study show a significant difference in the ADCmin values on MRI between low- and high-grade meningiomas. A negative correlation was found between histopathologic grade and ADCmin.
Key Words: Meningioma, Apparent diffusion coefficient, Magnetic resonance imaging, Histopathological grade, Quantitative.
INTRODUCTION
Apart from glial tumors, meningiomas are the most common intracranial tumors, constituting 15-25% of all primary intracranial tumors.1 The World Health Organization (WHO) first classified meningiomas in 1993 with updates being undertaken in 2000 and 2007. With the update in 2007, the presence of brain invasion was added as a factor increasing the tumor grade. According to the WHO classification, meningiomas are graded into three groups: grade I (low grade or benign), grade II (atypical), and grade III (anaplastic or malignant).
In the WHO 2016 classification, the presence of brain invasion with four or more mitoses was accepted to be sufficient for the diagnosis of atypical meningioma.2 Backer et al. reported that the classification and grading recommendations of WHO published in 2000, 2007 and 2016 led to a higher rate of grade II/III meningioma diagnoses with each update.3 Most meningiomas (90%) are low-grade or benign, and only 10% have an atypical or malignant character.4,5 While benign meningiomas have slow growth, atypical or malignant meningiomas have been reported to be aggressive and associated with greater brain invasion.6-8 It was found that the presence of brain invasion finding in WHO grade I meningiomas had a similar degree of recurrence and mortality as grade II.2
Although magnetic resonance imaging (MRI) is extremely successful in diagnosing meningiomas, the distinction between conventional MRI findings and benign meningiomas from atypical and/or malignant types remains difficult.9,10 The clinical contribution of conventional MRI findings is, therefore, limited. A follow-up protocol is frequently used in the treatment of patients diagnosed with an asymptomatic meningioma, surgical treatment is recommended in those with symptomatic or compressive effects.11 Additional treatment is not recommended for postoperative grade I meningioma cases, but radiotherapy is indicated for grade II/III patient.12 The main factor that determines the prognosis in the course of the disease is the development of recurrence, which is more common in the invasive forms of meningioma.13
In the treatment of meningiomas, histopathological and immunochemical grading is the main factor that determines the management of the disease. However, tissue samples are required for this grading process, and a differential diagnosis is not possible preoperatively. Therefore, being able to achieve a preoperative differential diagnosis of benign meningiomas and atypical and/or malignant meningiomas would be extremely important in predicting the disease prognosis. Considering both the advancements in technology in recent years and the increasing effectiveness of radiotherapy in clinical use in the treatment of meningiomas, the preoperative differential diagnosis of benign and atypical and/or malignant meningiomas may also lead to a possible update in the treatment protocol.
The aim of this study was to investigate the predictive role of the apparent diffusion coefficient (ADC) value measured by the preoperative Diffusion Weighted Imaging (DWI) technique in meningioma patients and explore the relationship of this value with histopathologic parameters, such as the Ki67 proliferation index and the number of mitoses.
METHODOLOGY
This retrospective study was approved by the Institutional Ethics Committee. Informed constent was obtained from each patient before the MRI examination. Patients diagnosed with meningiomas were retrospectively reviewed. The patients’ data were randomly and blindly (with no knowledge of pathological grades) transferred to the Microsoft Excel data system.
The data of 45 patients, 35 women and 10 men, who underwent imaging and surgery in Istanbul Medeniyet University Hospital between January 2015 and June 2019 and diagnosed with meningiomas as a result of a pathology evaluation, were retrospectively evaluated. Patients over 18 years of age, who were evaluated by preoperative MRI and histopathologically diagnosed with meningiomas, were included in the study. Cases with a history of intracranial disease, operation or radiotherapy, those for whom preoperative MRI data could not be obtained or there was not sufficient data for the required evaluation, and those without histopathologic examination tissue samples were excluded.
All patients were evaluated based on the results of contrast-enhanced cranial MRI performed with a 1.5 Tesla (Signa Excite; General Electric) device. The examination protocol comprised pre- and post-contrast enhanced axial and coronal T1-weighted (W) (TR/TE, 540/12 ms), axial T2W (TR/TE, 3000/80 ms), axial and coronal fluid-attenuated inversion-recovery (FLAIR) sequences (TR/TE, 7500/95 ms), axial gradient echo sequence (TR/TE, 520/16 ms), DWI (TR/TE, 5900/98 ms; field of view, 250 × 250 mm; section thickness: 5 mm; matrix, 128 × 128; b value: 0 and 1,000 s/mm2). ADC maps were automatically generated by the implemented software according to the following equation: ADC (mm2/s−1) = [ln (S0/S1000)] / 1000, where S0 and S1000 represent the signal intensities of the images.
The size of the masses, T1 and T2 signal characteristics, enhancement patterns, vascularity, presence of intracranial edema or shift, bone invasion, and hyperostosis were recorded as conventional MRI findings. Quantitative measurements were performed on the ADC map using the workstation. The ADC values were measured in a standard region of interest (ROI) range (10-30 mm2) from the three consecutive sections where the mass had the largest width and from the opposite white matter. The measurements were undertaken by two radiologists experienced in neuroradiology and blinded to the tumor grades. The minimum (ADCmin), mean (ADCmean), maximum (ADCmax), normalised (nADC), exponential (eADC) and normalised exponential (neADC) ADC values were recorded for the lesions and the opposite white matter. The nADC value was calculated by obtaining the ratio of the ADCmean value of the mass to that of the opposite white matter, and the neADC value was calculated by obtaining the ratio of the eADC value of the mass to that of the opposite white matter. The ADCmin, ADCmean, ADCmax and eADC values were also averaged. During the measurements, the cystic and calcific areas in the masses were excluded from ROI.
The pathology preparations of the patients were re-evaluated in accordance with the WHO 2016 classification updated by a pathologist specialized in neuropathology, who did not have knowledge of the MRI findings or the measured ADC values. For each lesion, the histopathologic subtype, Ki67 proliferation index (low 0-4, high ≥5) and degree of mitosis (low 0-3, high ≥4) were evaluated. In addition to brain invasion, the presence of cellularity, nucleolus prominence, spontaneous necrosis, small-cell formation (increased nucleus cytoplasm ratio in favor of nucleus) and loss of architecture were recorded for each patient. Ki67 was evaluated by counting at least 100 cells. According to the latest classification, if the histological type of a meningioma is clear or chordoid, it is directly included in the atypical group.2 In the presence of at least three of these criteria or brain invasion, the cases were classified as grade II meningioma. The meningioma cases meeting the anaplasia criteria were accepted as grade III.
According to the pathology results, the patients were divided into two groups as low grade (grade I) and high grade (grade II: atypical, grade III: anaplastic/malignant). If high proliferation was detected in meningiomas that were histologically benign, this was indicated in the histopathologic evaluation report as a high-proliferation meningioma. The patients with low-grade meningiomas were considered as Group 1 with low recurrence risk, and those with grade II/III were placed in Group 2 with high recurrence risk.
In the analysis of data, PSPP (free software) and Microsoft Excel programme were used. As statistical methods, descriptive analyses (frequency distributions, percentage, mean and standard deviation) and Shapiro-Wilk test for normality distribution were applied.
Table I: Comparison of conventional MRI findings in both groups.|
Variables |
Group |
|||||
|
1 |
2 |
|||||
|
Count |
% |
Count |
% |
p-value |
||
|
Localisation of mass |
Frontal |
5 |
35.7% |
7 |
50.0% |
0.676 |
|
Parietal |
2 |
14.3% |
2 |
14.3% |
||
|
Temporal |
3 |
21.4% |
2 |
14.3% |
||
|
Occipital |
0 |
0.0% |
1 |
7.1% |
||
|
Infratentorial |
0 |
0.0% |
1 |
7.1% |
||
|
Intraventricular |
1 |
7.1% |
0 |
0.0% |
||
|
Parasellar |
1 |
7.1% |
0 |
0.0% |
||
|
Planum sphenoidale |
2 |
14.3% |
1 |
7.1% |
||
|
Contour of the menengioma |
Regular |
5 |
35.7% |
1 |
7.1% |
0.143 |
|
Lobulated |
8 |
57.1% |
10 |
71.4% |
||
|
Irregular |
1 |
7.1% |
3 |
21.4% |
||
|
Signal Intensity at T1 |
Hypointense |
3 |
21.4% |
4 |
28.6% |
>0.999 |
|
Isointense |
11 |
78.6% |
10 |
71.4% |
||
|
Hyperintense |
0 |
0% |
0 |
0% |
||
|
Mixed |
0 |
0% |
0 |
0% |
||
|
Signal Intensity at T2 |
Hypointense |
2 |
14.3% |
0 |
0.0% |
0.435 |
|
Isointense |
3 |
21.4% |
4 |
28.6% |
||
|
Hyperintense |
6 |
42.9% |
5 |
35.7% |
||
|
Mixed |
3 |
21.4% |
5 |
35.7% |
||
|
Vascularity |
Negative |
6 |
42.9% |
3 |
21.4% |
0.637 |
|
Mild |
3 |
21.4% |
5 |
35.7% |
||
|
Moderate |
2 |
14.3% |
3 |
21.4% |
||
|
Intensive |
3 |
21.4% |
3 |
21.4% |
||
|
Contrast enhancement |
Mild |
1 |
7.1% |
2 |
14.3% |
0.111 |
|
Moderate |
7 |
50.0% |
3 |
21.4% |
||
|
Intensive |
5 |
35.7% |
3 |
21.4% |
||
|
Heterogeneous |
1 |
7.1% |
6 |
42.9% |
||
|
Calcification |
Negative |
7 |
50.0% |
6 |
42.9% |
0.705 |
|
Positive |
7 |
50.0% |
8 |
57.1% |
||
|
Edema |
Negative |
4 |
28.6% |
1 |
7.1% |
0.423 |
|
Mild |
3 |
21.4% |
6 |
42.9% |
||
|
Moderate |
2 |
14.3% |
2 |
14.3% |
||
|
Intensive |
5 |
35.7% |
5 |
35.7% |
||
|
Midline shift |
Negative |
3 |
21.4% |
2 |
14.3% |
>0.999 |
|
Positive |
11 |
78.6% |
12 |
85.7% |
||
|
Additional lesion |
Negative |
13 |
92.9% |
11 |
78.6% |
0.596 |
|
Positive |
1 |
7.1% |
3 |
21.4% |
||
|
Cystic degeneration |
Negative |
9 |
64.3% |
7 |
50.0% |
0.445 |
|
Positive |
5 |
35.7% |
7 |
50.0% |
||
|
Hyperostosis |
Negative |
10 |
71.4% |
10 |
71.4% |
>0.999 |
|
Positive |
4 |
28.6% |
4 |
28.6% |
||
|
Cranium involvement |
Negative |
12 |
85.7% |
11 |
78.6% |
>0.999 |
|
Positive |
2 |
14.3% |
3 |
21.4% |
||
|
MRI: Magnetic resonance ımaging. |
||||||
Since the data were suitable for normal distribution, the Independent sample t-test was used for continuous variables and the chi-square/ Fisher’s exact test for discrete variables to measure the differences between the groups. The receiver operator characteristic (ROC) analysis was also performed to determine the cut-off point, followed by the sensitivity and specificity analysis. The results were evaluated at the 95% confidence interval and P <0.05 significance level.
RESULTS
The final sample meeting the inclusion criteria consisted of a total of 28 patients, 19 females and nine males. There were 14 patients in each group. Group 1 consisted of four (28.6%) males and ten (71.4%) females and Group 2 comprised five (35.7%) males and nine (64.3%) females.
Table II: Comparison of radiological and pathological findings. Group 1, Grade I; Group 2, Grade II and III meningiomas.|
Variables |
Comparison of radiological findings |
Comparison of radiological pathological findings |
||||||||||
|
Groups |
Grading of mitosis (mean ± S.D.) |
Increased cellularity (mean ± S.D.) |
KI67 (mean ± S.D.) |
|||||||||
|
Group 1 (Mean ± SD) |
Group 2 (Mean ± SD) |
p-value |
Low (0-3) |
High (≥4) |
p value |
Negative |
Positive |
p-value |
Low (0-4) |
High (≥5) |
p-value |
|
|
Volume of mass |
51.82 ± 52.07 |
42.16 ± 22.90 |
0.531 |
49.81±44.54 |
39.93±25.25 |
0.563 |
44.86±41.75 |
53.38±35.28 |
0.633 |
43.48±47.42 |
51.04±30.04 |
0.625 |
|
ADCmin |
722.98 ± 95.69 |
641.12 ± 91.42 |
0.029* |
712.52±86.71 |
605.88±97.66 |
0.009* |
705.62±95.95 |
611.33±85.44 |
0.029* |
721.11±98.62 |
636.97±86.18 |
0.025* |
|
ADCmean |
809.19 ± 115.80 |
753.55 ± 87.87 |
0.164 |
802.35±102.52 |
728.92±96.99 |
0.094 |
795.83±108.90 |
738.00±83.30 |
0.212 |
811.96±116.24 |
746.08±80.09 |
0.098 |
|
ADCmax |
925.95 ± 143.48 |
899.24 ± 105.04 |
0.579 |
915.70±127.72 |
904.83±122.75 |
0.839 |
910.54±134.36 |
918.76±95.43 |
0.883 |
928.18±143.89 |
894.62±99.32 |
0.486 |
|
nADC |
0.95 |
0.95 |
0.944 |
0.90±0.18 |
1.07±0.14 |
0.031* |
0.94±0.20 |
0.98±0.15 |
0.603 |
0.91±0.20 |
1.00±0.17 |
0.211 |
|
eADC |
448.33 ± |
469.67 ± 42.16 |
0.233 |
451.05±44.39 |
478.88±49.07 |
0.157 |
454.62±48.10 |
472.14±42.48 |
0.399 |
447.91±50.52 |
471.79±39.80 |
0.181 |
|
neADC |
1.06 |
1.09 |
0.757 |
1.05±0.18 |
1.15±0.24 |
0.248 |
1.05±0.18 |
1.15±0.25 |
0.243 |
1.05±0.20 |
1.10±0.20 |
0.526 |
|
ADC: Apparent diffusion coefficient; ADCmin: Minimum apparent diffusion coefficient value; ADCmean: Mean apparent diffusion coefficient value; ADCmax: Maximum apparent diffusion coefficient value; nADC: Normalised apparent diffusion coefficient value; eADC: Exponential apparent diffusion coefficient value; neADC: Normalised exponential apparent diffusion coefficient value; SD: Standart deviation; *P <0.05. |
||||||||||||
Table III: Comparison of histopathological findings in both groups.
|
Variables |
Group |
p-value |
||||
|
1 |
2 |
|||||
|
Count |
% |
Count |
% |
|||
|
Grading of mitosis |
Low (0-3) |
14 |
100.0% |
6 |
42.9% |
0.002* |
|
High (≥4) |
0 |
0.0% |
8 |
57.1% |
||
|
Small cell formation |
Negative |
14 |
100.0% |
12 |
85.7% |
0.481 |
|
Positive |
0 |
0.0% |
2 |
14.3% |
||
|
Increased cellularity |
Negative |
13 |
92.9% |
8 |
57.1% |
0.077 |
|
Positive |
1 |
7.1% |
6 |
42.9% |
||
|
Prominent Nucleoli |
Negative |
13 |
92.9% |
9 |
64.3% |
0.165 |
|
Positive |
1 |
7.1% |
5 |
35.7% |
||
|
Loss of normal architecture |
Negative |
14 |
100.0% |
10 |
71.4% |
0.098 |
|
Positive |
0 |
0.0% |
4 |
28.6% |
||
|
Spontaneous necrosis |
Negative |
13 |
92.9% |
11 |
78.6% |
0.596 |
|
Positive |
1 |
7.1% |
3 |
21.4% |
||
|
Ki67 |
Low (0-4) |
12 |
85.7% |
3 |
21.4% |
0.001* |
|
High (≥5) |
2 |
14.3% |
11 |
78.6% |
||
|
Brain invasion |
Negative |
14 |
100.0% |
9 |
64.3% |
0.041* |
|
Positive |
0 |
0.0% |
5 |
35.7% |
||
|
*P <0.05 |
||||||
The mean age of the patients was calculated as 64.14 ± 14.08 and 57.64 ± 16.32 years in Groups 1 and 2, respectively. There was no statistically significant difference between the groups in terms of age and gender distribution (p=0.269 and p>0.999). Fourteen patients (50%) were diagnosed with WHO grade I tumor, 11 with grade II (39.3%), and three with grade III (10.7%). When the mean volume of the masses was examined, it was determined as 51.82 ± 52.07 mm3 for Group 1 and 42.16 ± 22.9 mm3 for Group 2, with no statistically significant difference between the groups (p >0.05).
There was no statistically significant difference between the two groups in the comparative analysis of the conventional MRI findings (Table I). In the statistical comparative analysis of the ADCmin, ADCmean, ADCmax, nADC, eADC and neADC values measured in both groups, the ADCmin mean values were determined to be statistically significantly lower in Group 2 compared to Group 1 (p = 0.029). However, there was no statistically significant difference between the groups in terms of ADCmean, ADCmax, nADC, eADC and neADC (Table II).
Using the ROC curve, the efficiency of the mean mass volume, ADCmin, ADCmean, ADCmax, nADC, eADC and neADC was compared, and the ADCmin value was found to be a statistically significant discriminating variable (p = 0.037 area under the ROC curve = 0.73). The ADCmin value was also statistically significant for the differentiation of tumor grades (p = 0.018). For the differentiation of grade I and grade II/III meningiomas, the cut-off point for the ADCmin value was 0.634x 10⁻³mm2s (Figure 1). An ADCmin value of 0.634x10⁻³mm2s or below had a sensitivity of 86% and specificity of 57% for the prediction of preoperative grade II/III meningiomas. In addition, the positive and negative predictive values of this parameter were calculated as 66.7% and 80%, respectively.
When the histopathologic subtypes of meningioma patients in Group 1 and 2 were examined, there were five transitional, three fibroblastic, three meningothelial, one psammomatous and two high Ki67 proliferation index meningioma subtypes in Group 1, while four meningothelial, three anaplastic, three fibroblastic, two clear-cell, one transitional and one angiomatous meningioma subtypes were identified for Group 2.
In the comparative analysis of histopathologic parameters, a statistically significant difference was found between the two groups in terms of mitosis and Ki67 proliferation index, which were higher in Group 2 (p=0.002 and 0.001, respectively). No statistically significant difference was determined between the groups in terms of small-cell formation, increased cellularity, nucleolus prominence, loss of normal architecture, and spontaneous necrosis (p>0.05). While brain invasion was not detected in any of the 14 patients in Group 1, it was present in five of 14 patients in Group 2. As shown in Table III, there was a statistically significant difference in favor of Group 2 in terms of the distribution of brain invasion between the groups (p=0.041).
When the absence or presence of increased cellularity was compared, the group with increased cellularity had statistically significantly lower ADCmin values (p = 0.029). When the patients with low and high Ki67 values were compared, the group with high Ki67 values had statistically significantly lower ADCmin values (p = 0.025, Table II). In addition, when the patients with low and high mitosis degree were compared, the group with high mitosis degree had statistically significantly lower ADCmin and higher nADC values (p = 0.009 and 0.031, respectively).
In Group 1, the Ki67 proliferation index was low in 12 patients and high in two. The mean ADCmin values were calculated as 0.675x10⁻³mm2s for the two patients with high Ki67 and 0.730x10⁻³mm2s for the remaining patients in Group 1. In Group 2, three of the 14 patients had low and 11 had high Ki67. In this group, the mean ADCmin values of the patients with low and high Ki67 were 0.682 x 10⁻³mm2s, and 0.630 x 10⁻³mm2s, respectively.
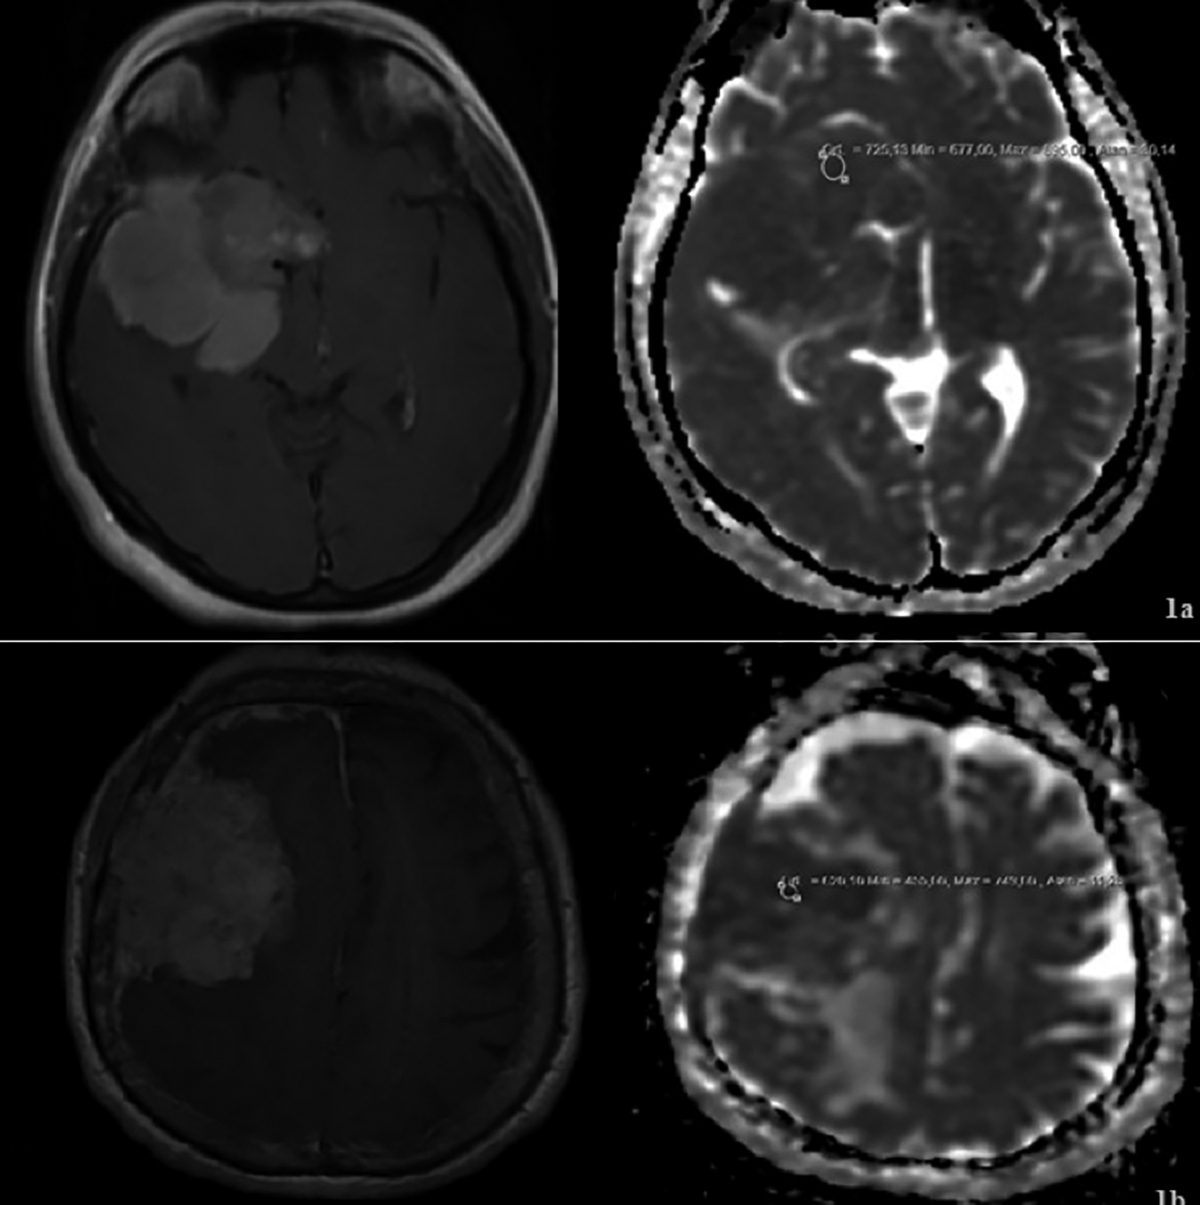 Figure 1: (a) Postcontrast T1-weighted axial image demonstrates hyperintens and homogeneously enhancement with a lobulated contour mass that is a Grade 1 meningioma diagnosed by histopathology; avarage value of ADCmin is 0.725x10⁻³mm2s on ADC map. (b) Postcontrast T1- weighted axial image demonstrates hyperintens and heterogeneously enhancement with a lobulated contour mass that is a Grade 2 meningioma diagnosed by histopathology; avarage value of ADCmin is 0.455x10⁻³mm2s on ADC map.
DISCUSSION
MRI is a reliable method in the diagnosis of meningiomas; however, currently there is still no conventional MRI finding that can distinguish the more common grade I form of meningiomas from grade II/III.14 Various characteristics, such as heterogeneous appearance and contrast enhancement, edema around the lesion, or irregular cerebral surface are not specific or sensitive for atypical/malignant meningiomas. Consistently, in the current study, the preoperative conventional MRI findings did not contribute to the prediction of meningioma grading.
ADC measurement is a current, non-invasive, reliable technique for the preoperative evaluation and treatment planning of different types of brain tumors. The relationship between ADC levels and meningioma grading has been evaluated in many studies, of which some reported that preoperative ADC did not have a predictive value in the differentiation of grade I and grade II/III meningiomas,15,16 while others recommended the preoperative evaluation of this parameter.4,17 The measurement of different ADC values in grade I and grade II/III meningiomas is associated with the level of cellularity within the mass. Masses with increased cellularity have more diffusion restrictions than less cellular masses, which corresponds to lower ADC values.4 This is consistent with the detection of lower ADCmin values in patients with increased cellularity.
With the update published by WHO in 2016, meningioma grading was better described in order to obtain higher success in treatment management. However, the literature review showed that there was still uncertainty concerning the ADC levels in studies conducted after 2016. In some of the studies based on the WHO 2016 classification, it has been reported that ADC level does not contribute to the preoperative differentiation of grade I and grade II/III meningiomas.18,19 In contrast, Aslan et al. reported that especially the ADCmin value was one of the best parameters in the differential diagnosis of grade I and grade II/III meningiomas.20 This was supported by the findings of Azeemuddin et al. who found ADCmean values in patients with low-grade (II/III) meningiomas.21 In this study, the comparative ROC analysis based on the histopathological findings using the WHO 2016 classification revealed the cut-off point for the ADCmin value as 0.634x10⁻³mm2s for the differentiation of grade I and grade II/III meningiomas. Nevertheless, we did not observe a similar relationship for the ADCmean value, which is in agreement with the results reported by Aslan et al. for ADCmin.22
The relationship between the ADC values and Ki67 has been investigated in many previous studies. In the current study, the ADCmin value was statistically significantly lower in patients with increased Ki67 levels; however, the same statistical significance was not observed for the ADCmean value, although it was close to the significance threshold (p = 0.098).
Ki67 proliferation index is correlated with an increased mitotic index, atypical and anaplastic histology, and poor clinical course.22 Tang et al. observed high ADC and low Ki67 in 83% of patients with grade I meningiomas.22 This pattern also indicates low recurrence. In the same study, low-tumor grades were accompanied by low ADC and relatively high Ki67 values in 8.6% of patients, and the clinical course was aggressive in 50% of this group.22 This reveals the need for the careful follow-up of patients for recurrence. In the current study, two of grade I cases had high Ki67 and low ADC values. We monitor these patients closer in terms of recurrence. Low ADC and high Ki67 are expected to be more frequent in aggressive meningiomas with high risk of recurrence. In our study, in Group 2 with grade II/III meningiomas, most patients (11/14) had high Ki67 and low ADC values, and Ki67 was found to be low in three patients (3/14). In such patients, low ADC values can be an indication of a high tumor grade, and inconsistent Ki67 values may require a rigorous secondary review by a pathologist for malignant criteria.
Evaluated together, Ki67 and ADC values can provide important information in terms of the clinical course, prognosis and recurrence of meningiomas. While routine conventional MRI does not offer predictive data for grade differentiation, this can be achieved using ADC values. Especially in low-grade meningiomas, the coexistence of low ADC and high Ki67 values is a good indicator of poor prognosis. Similarly, Tang et al. suggested that regardless of histological grade, high ADC values (especially >1×10⁻³ mm2/s) could be a predictor of a better prognosis.22
Among the limitations of the study are retrospective nature, single-centre design, small sample, and thus the low number of grade III malignant meningiomas. In addition, in the low-grade group, the patients with high mitosis, Ki67 proliferation index and cellularity and low ADC values can be interpreted to be significant in terms of the development of recurrence, which is the most important factor in the prognosis of meningioma cases. Similarly, lower mitosis, Ki67 and cellularity and higher ADC values may be considered to indicate a better prognosis in high-grade patients. However, since the follow-up of our patients is ongoing, which can be considered as further limitation of this study in terms of clinical significance.
CONCLUSION
In preoperative imaging, ADC values added to conventional MRI can play a role in the grade prediction of meningiomas. We anticipate that ADCmin values, correlated with histopathologic data, will provide more benefit in the follow-up of meningioma cases in terms of prognosis and recurrence.
ETHICAL APPROVAL:
Ethics Committee approval for the study was received from the Istanbul Medeniyet University, Goztepe Training and Research Hospital (protocol No: GEAH-KAEK 2018/0488).
PATIENTS’ CONSENT:
The necessary consent forms were obtained from the patients for the study.
CONFLICT OF INTEREST:
Authors declared no conflict of interest.
AUTHORS’ CONTRIBUTION:
BA: Substantial contributions to the conception or design of the work, or the acquistion, analysis, or interpretation of data for the work, drafting the work or revising it critically for important intellectual content.
SSE: Substantial contributions to the conception or design of the work, or the acquistion, analysis, or interpretation of data for the work, drafting the work or revising it critically for important intellectual content.
NOO: The acquistion, analysis, or interpretation of data for the work, drafting the work or revising it critically for important intellectual content.
REFERENCES
- Bondy M, Ligon BL. Epidemiology and etiology of intracranial meningiomas: A review. J Neurooncol 1996; 29(3): 197-205. doi: 10.1007/BF00165649.
- Louis DN, Perry A, Reifenberger G, von Deimling A, Figarella-Branger D, Cavenee WK, et al. The 2016 World Health Organization classification of tumors of the central nervous system: A summary. Acta Neuropathol 2016; 131(6): 803-20. doi: 10.1007/s00401-016-1545-1.
- Backer-Grondahl T, Moen BH, Torp SH. The histopathological spectrum of human meningiomas. Int J Clin Exp Pathol 2012; 5(3):231-42.
- Bano S, Waraich MM, Khan MA, Buzdar SA, Manzur S. Diagnostic value of apparent diffusion coefficient for the accurate assessment and differentiation of intracranial meningiomas. Acta Radiol Short Rep 2013; 2(7):2047981613 512484. doi: 10.1177/2047981613512484.
- Perry A, Stafford SL, Scheithauer BW, Suman VJ, Lohse CM. Meningioma grading: an analysis of histologic parameters. Am J Surg Pathol 1997; 21(12):1455-65. doi: 10.1097/ 00000478-199712000-00008.
- Ayerbe J, Lobato RD, de la Cruz J, Alday R, Rivas JJ, Gomez PA, et al. Risk factors predicting recurrence in patients operated on for intracranial meningioma. A multivariate analysis. Acta Neurochir (Wien) 1999; 141(9):921-32. PubMed PMID: 10526073. Epub 1999/10/20.
- Hakyemez B, Yildirim N, Gokalp G, Erdogan C, Parlak M. The contribution of diffusion-weighted MR imaging to distinguishing typical from atypical meningiomas. Neuroradiology 2006; 48(8):513-20. doi: 10.1007/s00234-006-0094-z.
- Komori T. The 2016 WHO classification of tumours of the central nervous system: The major points of revision. Neurol Med Chir (Tokyo) 2017; 57(7):301-11. doi: 10.2176/nmc.ra.2017-0010.
- Mahmood A, Caccamo DV, Tomecek FJ, Malik GM. Atypical and malignant meningiomas: A clinicopathological review. Neurosurgery 1993; 33(6):955-63. doi: 10.1227/000 06123-199312000-00001.
- Verheggen R, Finkenstaedt M, Bockermann V, Markakis E. Atypical and malignant meningiomas: evaluation of different radiological criteria based on CT and MRI. Acta Neurochir Suppl 1996; 65:66-9. doi: 10.1007/978- 3-7091-9450-8_19.
- Goldbrunner R, Minniti G, Preusser M, Jenkinson MD, Sallabanda K, Houdart E, et al. EANO guidelines for the diagnosis and treatment of meningiomas. Lancet Oncol 2016; 17(9):e383-91. doi: 10.1016/S1470-2045(16)30321-7.
- Hanft S, Canoll P, Bruce JN. A review of malignant meningiomas: Diagnosis, characteristics, and treatment. J Neurooncol 2010; 99(3):433-3. doi: 10.1007/s11060- 010-0348-9.13.
- Lam Shin Cheung V, Kim A, Sahgal A, Das S. Meningioma recurrence rates following treatment: A systematic analysis. J Neurooncol 2018; 136(2):351-61. doi: 10.1007/ s11060-017-2659-6.
- Weber DC, Lovblad KO, Rogers L. New pathology classification, imagery techniques and prospective trials for meningiomas: The future looks bright. Curr Opin Neurol 2010; 23(6):563-70. doi: 10.1097/WCO.0b013e328340441e.
- Zikou A, Alexiou GA, Goussia A, Kosta P, Xydis V, Voulgaris S, et al. The role of diffusion tensor imaging and dynamic susceptibility perfusion MRI in the evaluation of meningioma grade and subtype. Clin Neurol Neurosurg 2016; 146:109-15. doi: 10.1016/j.clineuro.2016.05.005.
- Sanverdi SE, Ozgen B, Oguz KK, Mut M, Dolgun A, Soylemezoglu F, et al. Is diffusion-weighted imaging useful in grading and differentiating histopathological subtypes of meningiomas? Eur J Radiol 2012; 81(9):2389-95. doi: 10.1016/j.ejrad.2011.06.031.
- Filippi CG, Edgar MA, Ulug AM, Prowda JC, Heier LA, Zimmerman RD. Appearance of meningiomas on diffusion-weighted images: correlating diffusion constants with histopathologic findings. AJNR Am J Neuroradiol 2001; 22(1):65-72. doi: 10.1016/j.ejrad.2011.06.031.
- Lu Y, Liu L, Luan S, Xiong J, Geng D, Yin B. The diagnostic value of texture analysis in predicting WHO grades of meningiomas based on ADC maps: An attempt using decision tree and decision forest. Eur Radiol 2019; 29(3):1318-28. doi: 10.1007/s00330-018-5632-7.
- Ranabhat K, Bishokarma S, Agrawal P, Shrestha P, Panth R, Ghimire RK. Role of MR morphology and diffusion-weighted imaging in the evaluation of meningiomas: Radio-pathologic correlation. JNMA J Nepal Med Assoc 2019; 57(215):37-44.
- Aslan K, Gunbey HP, Tomak L, Incesu L. The diagnostic value of using combined MR diffusion tensor imaging parameters to differentiate between low- and high-grade meningioma. Br J Radiol 2018; 91(1088):20180088. doi: 10.1259/bjr.20180088.
- Azeemuddin M, Nizamani WM, Tariq MU, Wasay M. Role of ADC values and ratios of MRI scan in differentiating typical from atypical/anaplastic meningiomas. J Pak Med Assoc 2018; 68(9):1403-6.
- Tang Y, Dundamadappa SK, Thangasamy S, Flood T, Moser R, Smith T, et al. Correlation of apparent diffusion coefficient with Ki-67 proliferation index in grading meningioma. AJR Am J Roentgenol 2014; 202(6):1303-8. doi: 10.2214/AJR.13.11637.